Salstat2 Wiki
statistical package designed for the end user, multiplatform
Status: Abandoned
Brought to you by:
selobu
Salstat2 is an statistical package written in python and designed for the end user It has a graphical user interface and also it is scriptable, It's multiplatform, It has a graphic system inherited from matplotlib, It allows you to use different libraries like numpy - for numerical calculations, it also lets you to interact with Microsoft Excel (R) by using a com client under windows(R) platform and finally you can create your own dialogs by using the interactive shell or the script panel.

the following are some of the supported statistic functions:
* Variability: samplevar, sample stddev, var, stddev, signaltonoise,
* Anova one way
* Probability calcs: chisqprob, ercfunc, zprob func, betacf, betai
* Correlation functions: pearsonr, spearman, pointbiserialr, kendalTau, linregress
* Moments: variation, skew, kurtosis, skew test, kurtosis test, normal test
* Inferential stats
* Frequency stats
* Central Tendency: mean, geometric mean, harmonic mean, median mode
* Short data and see the original order
* Six Sigma, to be used in global analysis for continuos data
A more detailed list ![here][Scripting_statistics]
In the plotting system you can draw around twenty different types of charts, at the same time you can interactively make some changes like the title, x label, y label, scales, turn on or off the grid, to change line colour, and many more. some of the plotting types are:
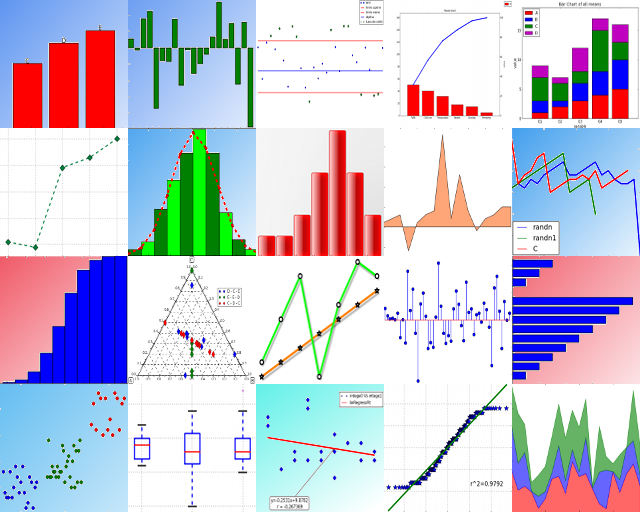
Box & whisker, Linear regresion plot, Normal probability plot, Scatter chart, Ternary scatter chart, Histogram chart - optionally you can draw a normal curve, Multiple are chart, Bar chart of all means, Line chart of all means, bar chart, Horizontal bar chart,
stacked bars, Cumulative histogram chart, Stem chart, area chart, control chart, Line charts of the data, adaptive plot, pareto Chart since S2 v2.1 rc2.
eps, emf, jpeg, jpg, pdf, png, ps, raw, rgba, svg, svgz, tif, tiff
All the numerical result are send to a sheet in a diferent panel where you can copy, paste, cut and edit.
If the resulting text is too large and you can't see it in a cell then you can see it in a toolbar designed for that.
the software provides a class to manage data as a pivot data table
The software provides a shell where you can interactively manipulate objects of the software as the:
* The data Entry panel.
* The response panel.
* The statistics.
* The numpy library.
* A class to easily dialog creation
Salstat2 will provide a new transformation panel since version 2.2, where you can do a lot of calculations with the columns in the main panel and by using the provided statistical functions.
![]()
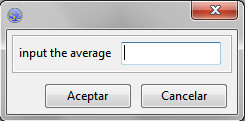
You can easily create custom dialogs by using a provided class dialog, for example,
you can run the following script from the shell:
dlg= dialog()
txt1= Ctrl.StaticText("Input the average")
edit= Ctrl.NumTextCtrl()
struct= [[txt1, edit]]
dlg.struct= struct
dlg.ShowModal()