Menu
▾
▴
Posted by
 2019-01-30
Labels:
MIDI
music
sequencer
polymeter
composition
graphviz
visualization
2019-01-30
Labels:
MIDI
music
sequencer
polymeter
composition
graphviz
visualization
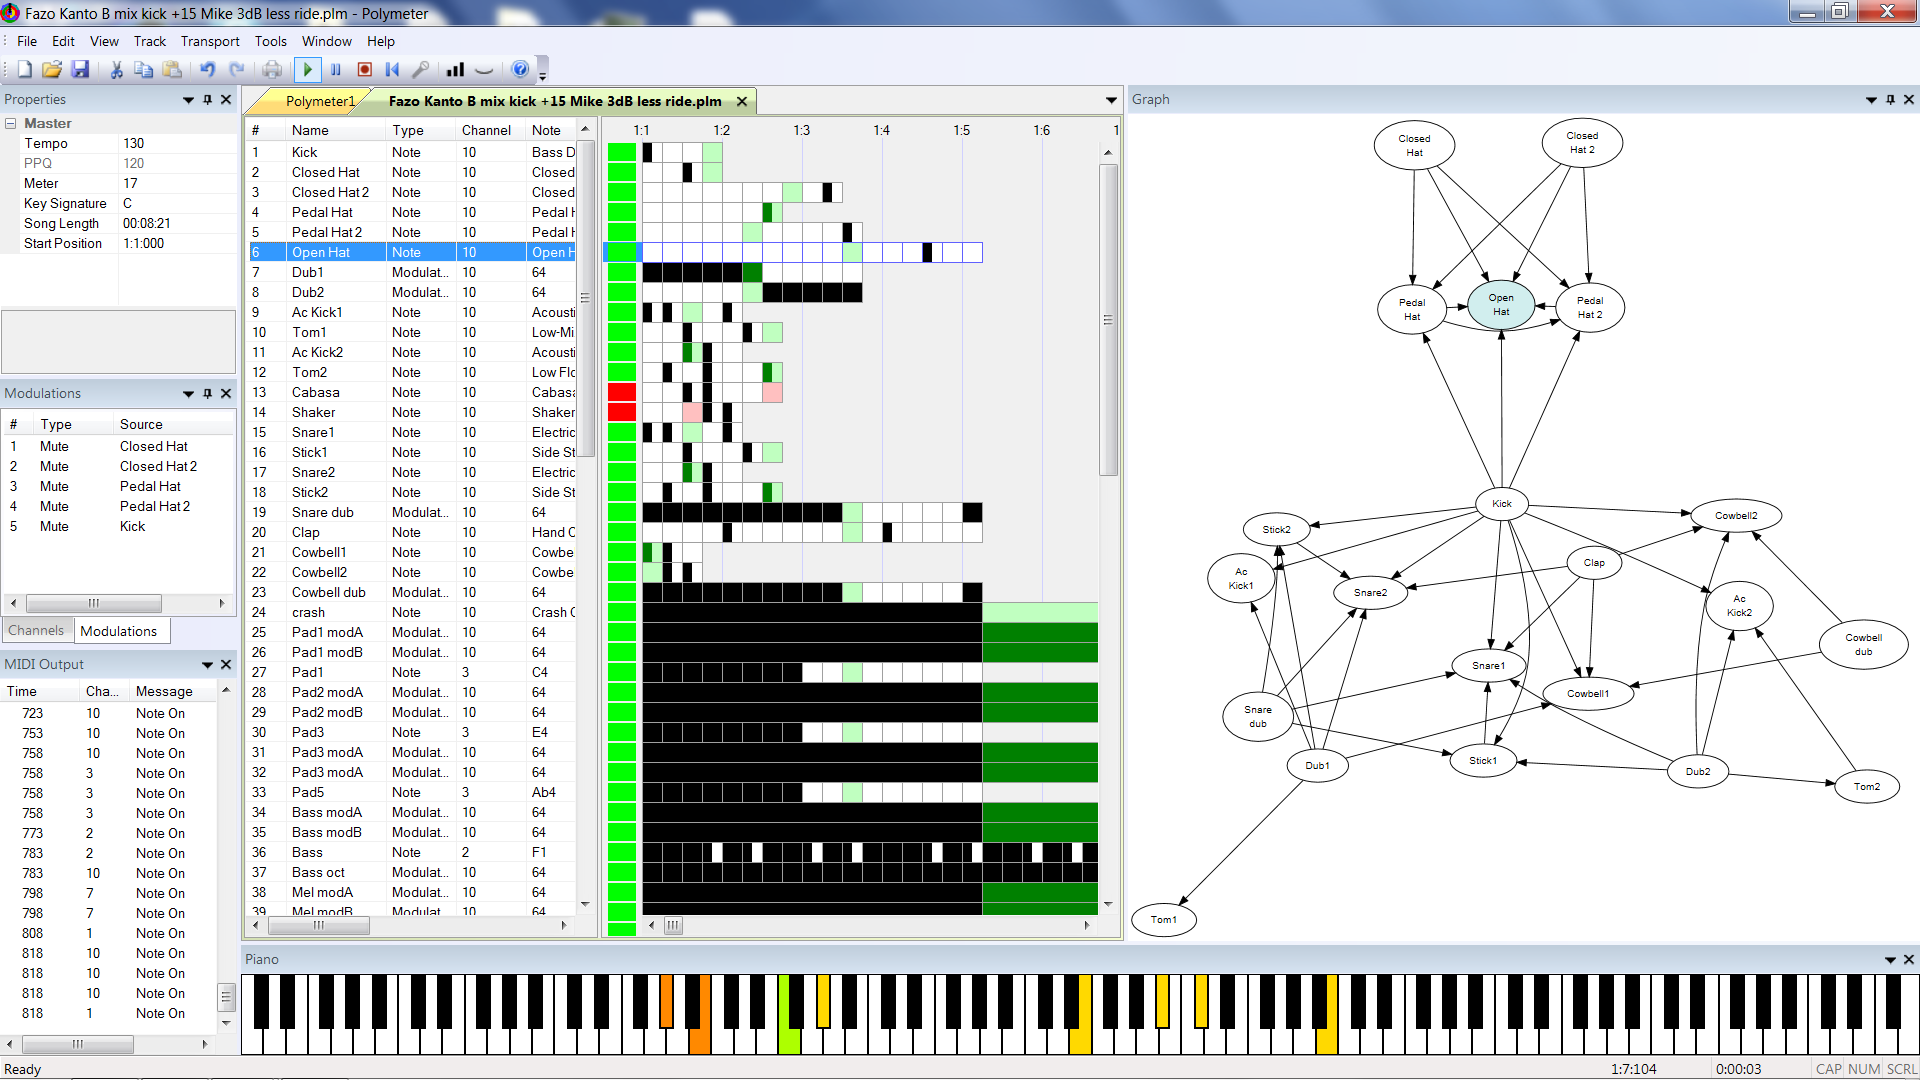
Polymeter 0.0.23 adds graphing capability
Polymeter 0.0.23 introduces graphing, to help you visualize your modulations. The heavy lifting of generating the graph is done by Graphviz, an excellent free software that's used in many projects including Doxygen. The scope of the graph can be one of these:
| Scope | Description |
|---|---|
| All | Show all modulations regardless of track selection |
| Selected | Show direct modulators of selected tracks |
| Recursive | Show direct and indirect modulators of selected tracks |
| Bidirectional | Show direct and indirect modulators and modulatees of selected tracks |
Various graph layouts are supported, including dot(for heirarchical graphs) and neato (for relational graphs). The edges are colored to indicate modulation type, and edge labels can optionally be displayed. The graph is generated as vectors (SVG format) so it's zoomable, and can be exported for printing. Hovering over a node's label shows a tooltip containing the track number. The graph is displayed using a web browser control (IWebBrowser2). Note that the recommended Internet Explorer version is 11 or later (Edge); earlier versions of IE may display the graph incorrectly or not at all.
This version also features a MIDI input bar that lists MIDI input events with filtering options.