myHouse Wiki
Home monitoring and automation suite now known as eGeoffrey
Brought to you by:
user2684
Ensure you have reviewed carefully the product documentation which details the logic upon which myHouse is based, its components, the plugins and the notification mechanisms available.
A module (represented as an array of modules in the configuration file and presented as an item in the left sidebar), is a collection of sensors (where statistics are collected or generated and identified by the tuple module_id, group_id, sensor_id), widgets (to represent in the UI the data of one or more sensors and identified by a widget_id) and rules (to automatically perform actions when specific conditions are met and identified by a rule_id).
A widget is a box showing up in the UI. It has its own unique identifier called widget_id, a display_name mapping for each language a string label to display on top of the box, a size (between 1 and 12) and an array of layout.
          {
            "widget_id": "alarm_status",
            "display_name": {
              "en": "Alarm Status"
            },
            "enabled": true,
            "size": 3,
            "layout": [
              {
                "type": "current_header",
                "icon": "alarm/main/alarm_status/image",
                "timestamp": "alarm:main:alarm_status"
              },
              {
                "type": "checkbox",
                "sensor": "alarm:main:alarm_status"
              }
            ]
          }
A layout can present just a simple measure, or a complex timeline chart with data from multiple sensors, a control checkbox , etc. Refer to the config-schema.json for a full list of the available layouts and their required parameters.
A rule is a recurrent evaluation of a set of conditions and when met, a notification and an optional set of actions will be performed. A rule has a unique identified (rule_id), the text of the notification (within display_name by mapping each language to a string label. Placeholders can be used by adding % before and after a definition), a severity (different types of notifications can be configured based on the severity), a time interval (how frequently the rule is run, defined by run_every), an array of definitions (mapping a label to a sensor or a static value), a set of conditions (comparing the definitions), and an optional array of actions (to set a value to a sensor or to send a message to an actuator).
For example:
        {
          "rule_id": "alarm_set_off",
          "display_name": {
            "en": "The alarm has been disarmed"
          },
          "enabled": true,
          "severity": "info",
          "run_every": "minute",
          "conditions": [
            "alarm_set_off == status_on"
          ],
          "definitions": {
            "alarm_set_off": "alarm:main:alarm_set_off,-1,-1",
            "status_on": 1
          },
          "actions": [
            "set,alarm:main:alarm_set_off,0",
            "set,alarm:main:alarm_status,0"
          ]
        }
In a definition, one or more values from a sensor can be retrieved with the notation <module_id>:<group_id>:<sensor_id>,<start_position>,<end_position>, with -1 being the last value in the database. So for example alarm:main:alarm_set_off,-1,-1 will return the last measure of the alarm:main:alarm_set_off sensor.
Rules without any condition defined are somehow special and used for scheduled notifications or for direct queries by the slack bot or by voice commands. For example the following will send out a daily notification with today's temperatures:
        {
          "rule_id": "indoor_temperature_today",
          "display_name": {
            "en": "So far, today's first floor average temperature has been %temperature_avg%, the maximum %temperature_max%, minimum %temperature_min%. The current temperature is now %temperature_now%"
          },
          "enabled": true,
          "severity": "info",
          "run_every": "day",
          "conditions": [],
          "definitions": {
            "temperature_now": "indoor:temperature:study_room,-1,-1",
            "temperature_max": "indoor:temperature:study_room:day:max,-1,-1",
            "temperature_min": "indoor:temperature:study_room:day:min,-1,-1",
            "temperature_avg": "indoor:temperature:study_room:day:avg,-1,-1"
          }
        }
You can use the "for" operator which will run the same rule for each sensor. In both "display_name" and "definitions", the placeholder %i% will be automatically replaced with your sensor. For example. the rule below will trigger if the temperature of any of the three sensors listed in "for" is below the threshold:
        {
          "rule_id": "indoor_temperature_low",
          "for": [
            "indoor:temperature:study_room",
            "indoor:temperature:living_room",
            "indoor:temperature:bedroom"
          ],
          "display_name": {
            "en": "Pay attention, the temperature inside is very low, %i% has reached %temperature_avg% during the last hour"
          },
          "enabled": true,
          "severity": "warning",
          "run_every": "hour",
          "conditions": [
            "temperature_avg < threshold"
          ],
          "definitions": {
            "temperature_avg": "%i%:hour:avg,-1,-1",
            "threshold": 14
          }
        },
A sensor (represented as an array of sensors in the configuration file) is characterized by a unique ID (the sensor_id), the module_id it belongs to and a group_id (used to group into the same widget multiple sensors).
Once declared, nothing happens until associated to a plugin or linked to a rule. In its minimum form, it has its ID (specified by the tuple module_id, group_id, sensor_id), the nice name that will be used in any chart (specified in the display_name by mapping each language to a string label) and a format (which will be used to both normalize the values and append a suffix when needed):
         {
          "module_id": "indoor",
          "group_id": "temperature",
          "sensor_id": "living_room",
          "enabled": true,
          "display_name": {
            "en": "Living Room"
          },
          "format": "temperature"
        }
To start collecting statistics into the sensor's data structure, a plugin must be configured. Refer to the documentation for a full list of plugins and their capabilities. For a "pull" type of plugin, a polling_interval must be defined to periodically ask the plugin to retrieve the data (e.g. get the temperature from wunderground). For "push" type of plugin, this is not needed since new measures will be stored as they will arrive (e.g. temperature reported by a mysensor board at the end of a sleeping cycle). The configuration of each plugin varies so refer the config-schema.json for a full list of all the possible parameters. For example, a sensor configured with the MySensors plugin:
         {
          "module_id": "indoor",
          "group_id": "temperature",
          "sensor_id": "living_room",
          "enabled": true,
          "display_name": {
            "en": "Living Room"
          },
          "plugin": {
            "plugin_name": "mysensors",
            "node_id": 2,
            "child_id": 1,
            "command": "SET",
            "type": "V_TEMP",
            "gateway_id": "ethernet_1"
          },
          "format": "temperature"
        }
Once a plugin is configured, every new piece of data will be stored as a "current" measure. This can be used in a widget (to display the latest measure) or in a chart (with the timeframe set to "realtime"). But to automatically generate hourly and daily average, minimum and maximum statistics, a "summarize" properties must be added to the sensor. In this way the hourly data will be made available through the "recent" timeframe while the "daily data through the "history" timeframe when configuring a timeline widget.
         {
          "module_id": "indoor",
          "group_id": "temperature",
          "sensor_id": "living_room",
          "enabled": true,
          "display_name": {
            "en": "Living Room"
          },
          "plugin": {
            "plugin_name": "mysensors",
            "node_id": 2,
            "child_id": 1,
            "command": "SET",
            "type": "V_TEMP",
            "gateway_id": "ethernet_1"
          },
          "format": "temperature",
          "summarize": {
            "avg": true,
            "min_max": true
          }
        }
However, just referring a sensor or a group of sensors from a timeline widget, is not enough: what to display in the chart is defined by an array of "series". Those are highcharts properties and can be used to define which statistic to plot, colors, type of chart etc. The following, for example, will plot for each sensor two lines, one is the calculated average as a spline line, the other is an area between the minimum and maximum values, useful to visualize the range between min and max and how the average fits between the two:
         {
          "module_id": "indoor",
          "group_id": "temperature",
          "sensor_id": "living_room",
          "enabled": true,
          "display_name": {
            "en": "Living Room"
          },
          "plugin": {
            "plugin_name": "mysensors",
            "node_id": 2,
            "child_id": 1,
            "command": "SET",
            "type": "V_TEMP",
            "gateway_id": "ethernet_1"
          },
          "format": "temperature",
          "series": [
            {
              "series_id": "avg",
              "type": "spline"
            },
            {
              "series_id": "range",
              "type": "arearange"
            }
          ],
          "summarize": {
            "avg": true,
            "min_max": true
          }
        }
An actuator is represented like any other sensor in the configuration file but once a message is sent to it, the plugin associated will dispatch the message. Review the documentation for a list of plugins supporting this "output" capability. For example the following sensor can be used as an actuator:
        {
          "module_id": "indoor",
          "group_id": "boiler",
          "sensor_id": "control",
          "enabled": true,
          "display_name": {
            "en": "Boiler control"
          },
          "plugin": {
            "plugin_name": "mysensors",
            "node_id": 2,
            "child_id": 200,
            "command": "REQ",
            "type": "V_CUSTOM",
            "queue_size": 10,
            "gateway_id": "ethernet_1"
          },
          "format": "int"
        }
The are a number of ways to send a message to a sensor:
https://myhouse/<module_id>/<group_id>/<sensor_id>/send/<message> (e.g. https://myhouse/boiler/main/switch/send/1) "send_on": "boiler/main/switch/send/1",
"send_off": "boiler/main/switch/send/0"
or
"send": "boiler/main/switch/send/"
        {
          "rule_id": "boiler_main_on",
          "display_name": {
            "en": "Turning on the boiler"
          },
          "enabled": true,
          "severity": "info",
          "run_every": "never",
          "conditions": [],
          "definitions": {},
          "actions": [
            "send,boiler:main:switch,1"
          ]
        },
Slack is a sort of mix of past and future. Many organizations are using it as a tool to somehow replace emails so to allow collaboration instead of communication.
For the old school guys, it looks like IRC from a first look but with a lot of enhancements.
For the younger Internet folks it is like a whatsapp chat but with a lot of enhancements.
You can create a team on Slack, invite the people you want and organize discussions in channels. But how does this fit with myHouse? Well imagine to create a team for your family and invite your family members there. First of all you will get for free a whatsapp like chat and on top of it you can search the history, follow only the channles you are interested in and customize individual notification settings.
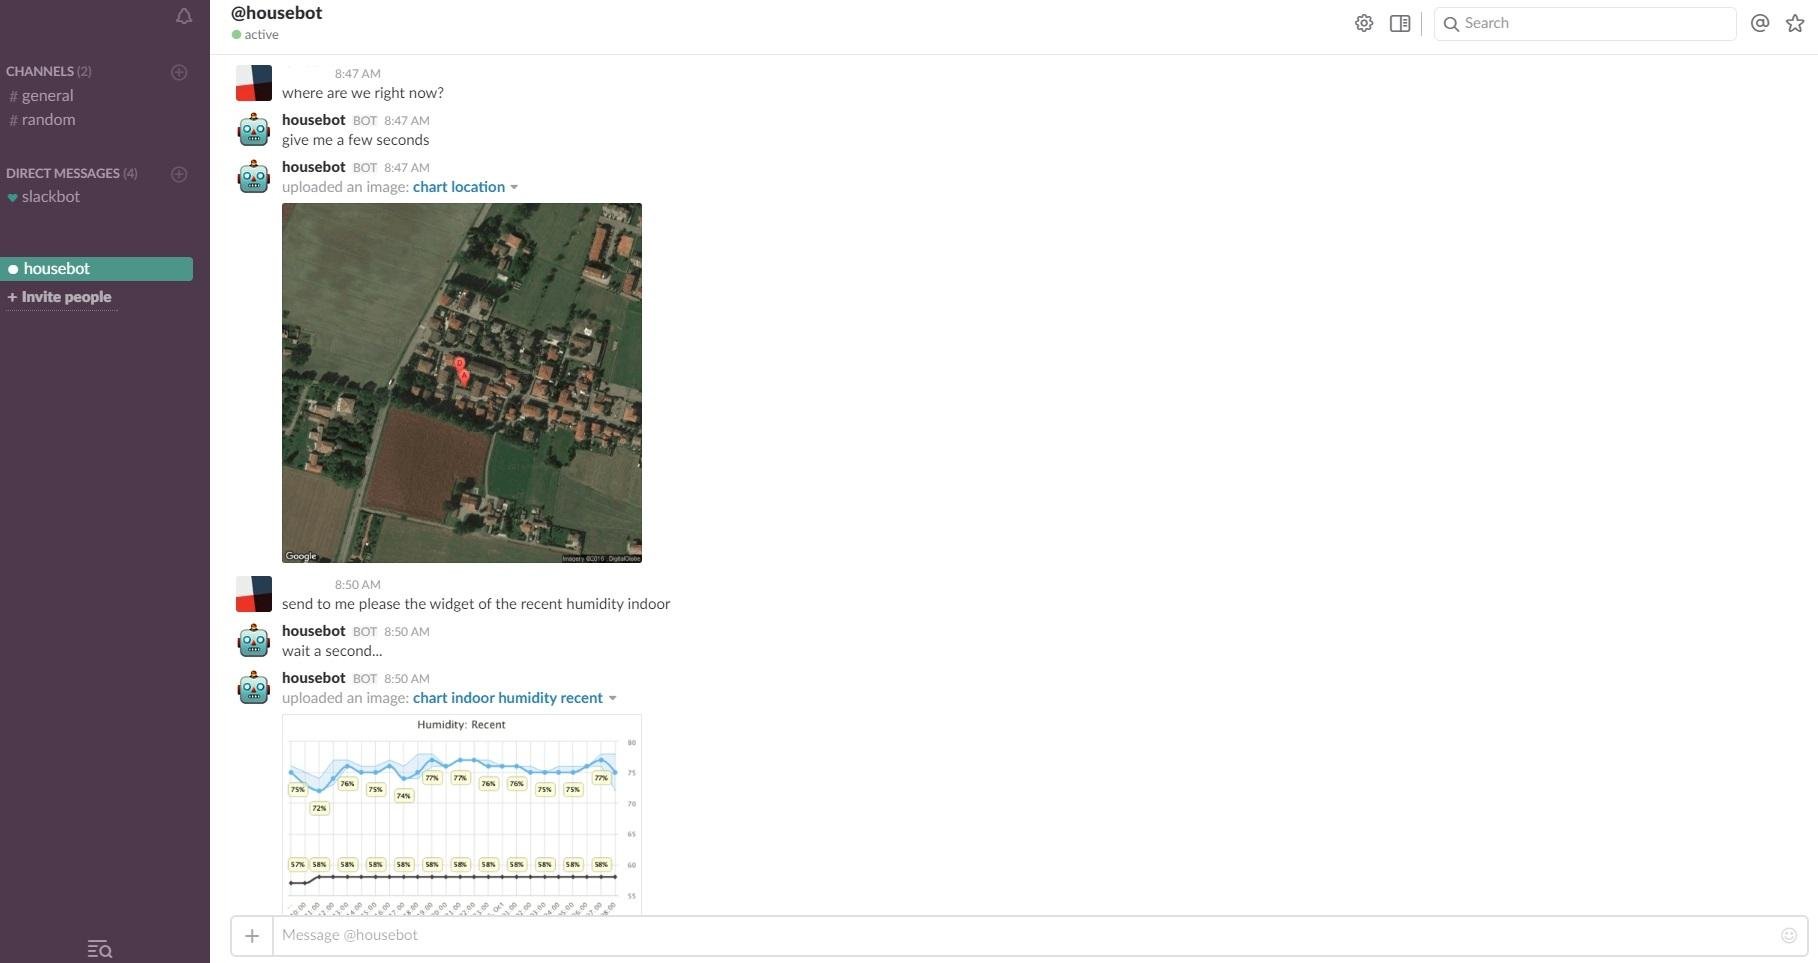
Then you can allow myHouse to join your team. myHouse will act as a bot in the channel of your choice and you can interact with it. You can ask remotely what is the temperature in the room, activate the heater, sharing with you any chart available on the interface. It basically allows remote control of all the aspects of myHouse without requiring a dedicated application. All of this in natural language, without the need to remind a long list of commands.
This is how it looks like interacting with the bot: https://a.fsdn.com/con/app/proj/my-house/screenshots/screenshot.15.jpg/1
The bot knowledge comes from the configured rules and widgets. This is how to configure it: https://sourceforge.net/p/my-house/wiki/Welcome%20to%20myHouse%20(v2.2)/#configuring-your-slack-bot
Slack is available as a web application, mobile apps or as a fat client.
Those calculations are scheduled to run hourly and daily but regardless a new measure coming in would update both the hourly and daily avg/min/max
myHouse has been tested with Python 2.7 and it is not expected to work with Python 3.x. You can try running it through 2to3 but this has not been tested.
myHouse since v2.3 runs just fine on a Orange Pi (http://www.orangepi.org/) running Armbian. This has been tested on a Orange Pi Zero (https://www.armbian.com/orange-pi-zero/).
All the plugins will be fully functional including the GPIO plugin.
To backup your confiugration, make a copy of the config.json file. To backup your data, simply make a copy of the redis database located at /var/lib/redis/dump.rdb. To restore your data, just copy back the files and restart both redis and myHouse.
To quickly get up to speed with myHouse and have a working weather station using the Weather Underground service:
From the raspberry's console:
sudo /etc/init.d/myhouse stop
sudo /etc/init.d/myhouse start
sudo /etc/init.d/myhouse restart
From the UI, click on the "Restart Service" in the "Configuration" module.
After editing your config.json file, if unsure if formatter correctly, just run
sudo python config.py
If there will be no output, great, the format is correct.
If the output is something like:
simplejson.scanner.JSONDecodeError: Expecting ',' delimiter or ']': line 2161 column 9 (char 58962)
This means the json is not formatted correctly, review line 2161 in this example.
If the output is something like:
The configuration file is not compliant with the schema or the schema is incorrect: {'handle': '0x0015', 'transform': '/10', 'plugin_name': 'bluetooth', 'mac': 'F6:F7:E0:BC:02:7A', 'polling_interval': 10, 'handle_type': 'notification'} is not valid under any of the given schemas
This means the json is formatted correctly but it is not compliant with the schema. Review the schema to ensure there are no required fields missing.
myHouse has no hard-coded embedded strings, everything which is displayed is coming from the user's configuration file. Widgets, sensors, rules, etc. they all have a display_name attribute which maps the language with the text. So for example if you want your myHouse in spanish, for each display_name add the spanish translation, e.g.
            "display_name": {
                "en": "External Temperature",
                "es": "Temperatura externa"
            }
Then in "general", set the "language" attribute accordingly:
"language": "es"
You can then switch the entire interface from a language to another by just changing this attribute.
Finally, if using Slack integration, the bot knows a set of pre-defined answers to most common questions which do not involve your configuration like what to say when the question has not been understood, when the user says hello, etc.
Copy thelanguage_en.dict file into something like language_es.dictand translate/change whatever you need. The bot will use the correct file based on the language set
Yes, you need multiple myHouse module each, for example, with a scheduler, main switch, target temperature etc. and a set of rules, identical across the modules, just referring the different sensors. This would create completely indipendent zones, each with a target temperature, heater controller and scheduler.
The scheduler is intended to be general purpose so the description can be the target temperature or anything else depending on the way you use it in a rule. It can be used e.g. for having a rule triggering only during specific days/timeframes or something else. Basically when a calendar type of sensor is used in a rule, it will return the description of the scheduled timeframe or nothing so that the description can be used in the logic of the rule.
he configuration of the slack bot is minimal since it will automatically "learn" from your rules and widgets allowing you to interact with it in your natural language. The learning phase is very simple, every display_name attribute is used to match your question with a potential pertinent answer and there is enough confidence in the match, the rule will be run and the response sent back to the user or the chart will be created and uploaded on slack.
In your configuration file, "input" -> "settings" controls how this match is done, the algorithm used and the minimum confidence to provide a valid answer. For more details, this is leveraging https://github.com/seatgeek/fuzzywuzzy.
The bot also knows some basic words just to say hello and goodbye. This is controlled by the file language_en.dict. The structure of the file is the following:
keywords=>answer1|answer2|answer3
Where keywords are random words separated by spaces used to match your question. If there will be a match and confidence is adequate, then a random answer will be chosen. E.g.
thanks thank you cheers=>no problem|always a pleasure|you're welcome
There are three special keywords:
%not_understood%: what to respond when the confidence is low so probably the bot did not understand the question
%prefix%: randomly added as a prefix of any response (e.g. Ok,|Let me tell you,|Listen, etc.)
* %wait%: what the bot will say just before creating a chart to upload to borrow the user some time
If you customize the file, please make a backup copy before upgrading so your changes will not be overwritten
(e.g. during the night, during the weekend, etc.)
add a calendar widget, configure the timeframes in which the rule will be applied and add a condition in your rule leveraging the sensor linked to the calendar. When a calendar is used in a rule would return the value set for that timeframe.
This can somehow achieved using the "command" plugin to request the calendar's current value and poll the value e.g. every 10 minutes or so. Something like:
          "plugin": {
            "plugin_name": "command",
            "command_poll": "curl http://myhouse/boiler/scheduler/calendar/current 2>/dev/null",
            "command_parse": "perl -ne '/(\d+)/;print $1'",
            "poll_interval": 10
          }
Then you can set your format to "temperature" and your preferred "summarize" settings so to automatically generate avg, min and max
Since the "series" property of a sensor is used "as is" as a highchart series, add the following to the series you want to hide the labels for:
"dataLabels": {"enabled": false}
You can use the "current_measure" layout which will just display the current measure and can be stacked. Display_name is optional but can be used to describe the sensor and a "timestamp" can be optionally added as well. For example:
    {
            "widget_id": "test_current",
            "display_name": {
              "en": "Test current"
            },
            "enabled": true,
            "size": 3,
            "layout": [
              {
                "display_name": {
                    "en": "Living Room"
                },
                "type": "current_measure",
                "sensor": "indoor:temperature:living_room"
              },
              {
                "type": "separator"
              },
              {
                "display_name": {
                    "en": "Ground Floor"
                },
                "type": "current_measure",
                "sensor": "indoor:temperature:ground_floor"
              },
              {
                "type": "separator"
              },
              {
                "display_name": {
                    "en": "Study Room"
                },
                "type": "current_measure",
                "sensor": "indoor:temperature:study_room"
              },
              {
                "type": "separator"
              },
              {
                "display_name": {
                    "en": "Boiler Scheduler"
                },
                "type": "current_measure",
                "sensor": "boiler:scheduler:calendar"
              }
            ]
          }
The following sensors are configured in myhouse and it is assuming a sleeping sensor which periodically calls home to pick up a command to execute:
All this logic is implemented with rules (which by default are all disabled).
In the example the target temperature of the widget would apply only when the boiler is turned on manually with the master switch while the target temperature set in the calendar when the boiler is on with the scheduler.
In this way one ca set a different target temperature for each scheduled timeframe but the ability to have an indipendent target temperature when turning on the boiler manually.
You can request either a unix timestamp or an elapsed time (in minutes) instead of a value for any sensor in a rule. For example the following "boiler:main:heartbeat,-1,-1,elapsed" returns how many minutes ago the latest entry (-1,-1) has been stored and 10 minutes in this example is the threshold. This run every minute ("run_every": "minute") and has an alert severity ("severity": "alert").
    {
          "rule_id": "boiler_sensor_lost_alert_on",
          "display_name": {
            "en": "The boiler sensor became unreachable, last time I've heard from it was %minutes_since% ago"
          },
          "enabled": true,
          "severity": "alert",
          "run_every": "minute",
          "conditions": [
            "minutes_since > threshold"
          ],
          "definitions": {
            "minutes_since": "boiler:main:heartbeat,-1,-1,elapsed",
            "threshold": 10,
          }
        },
You can use an additional sensor to keep track when the alert is on, like it was a variable. In the example below, to avoid the rule to send a notification after 10 minutes, 11 minutes, and so on, the first time it triggers set to 1 boiler:main:heartbeat_alert_status so when will run at 11 minutes, boiler:main:heartbeat_alert_status is already 1 and will not trigger. "heartbeat_alert_status" has no plugin associated with it, I just use it as it was a variable storing a single value.
      {
          "rule_id": "boiler_sensor_lost_alert_on",
          "display_name": {
            "en": "The boiler sensor became unreachable, last time I've heard from it was %minutes_since% ago"
          },
          "enabled": true,
          "severity": "alert",
          "run_every": "minute",
          "conditions": [
            "minutes_since > threshold",
            "heartbeat_alert_status == status_off"
          ],
          "definitions": {
            "minutes_since": "boiler:main:heartbeat,-1,-1,elapsed",
            "threshold": 10,
            "heartbeat_alert_status": "boiler:main:heartbeat_alert_status,-1,-1",
            "status_off": 0
          },
          "actions": [
            "set,boiler:main:heartbeat_alert_status,1"
          ]
        },
This can be coupled with anotherrule which is notifying when the sensor becomes reachable again. Same logic but different conditions, this triggers when the sensor was already unreachable (heartbeat_alert_status == 1) and we had a heartbeat (minutes_since < threshold):
        {
          "rule_id": "boiler_sensor_lost_alert_off",
          "display_name": {
            "en": "The boiler sensor is now reachable again"
          },
          "enabled": true,
          "severity": "alert",
          "run_every": "minute",
          "conditions": [
            "minutes_since < threshold",
            "heartbeat_alert_status == status_on"
          ],
          "definitions": {
            "minutes_since": "boiler:main:heartbeat,-1,-1,elapsed",
            "threshold": 10,
            "heartbeat_alert_status": "boiler:main:heartbeat_alert_status,-1,-1",
            "status_on": 1
          },
          "actions": [
            "set,boiler:main:heartbeat_alert_status,0"
          ]
        },
First of all yuo need a sensor configured with the "command" plugin to run your custom command when invoked. For example the below reconnect a bluetooth speaker:
        {
          "module_id": "power",
          "group_id": "command",
          "sensor_id": "speaker",
          "enabled": true,
          "plugin": {
            "plugin_name": "command",
            "command_poll": "hciconfig hci0 down; hciconfig hci0 up; echo \"connect F5:B6:AB:45:63:C6\"| bluetoothctl; sleep 5 && amixer sset 'Master' 70%",
            "poll_on_demand": true
          },
          "format": "string",
          "retention": {
            "realtime_count": 1
          }
        }
Then you need to add the button to a widget and configure the action so to make the command triggering when pressed:
          {
            "widget_id": "reconnect_speakers",
            "display_name": {
              "en": "Reconnect the speakers"
            },
            "enabled": true,
            "size": 4,
            "layout": [
              {
                "type": "button",
                "display_name": {
                  "en": "Reconnect"
                },
                "actions": [
                  "send,power/command/speaker/run/save"
                ]
              }
            ]
          }
You can customize the out-of-the-box backup policies or add your own in the "backup" section under "general" in your configuration file. By default myHouse will create a backup copy of the database file on a daily and weekly basis under its "tmp" folder.
myHouse can also push to the cloud a backup copy of your configuration file and database with the same frequency. If you want to use Google Drive, for example, you need to install on the raspberry the gdrive utility from https://github.com/prasmussen/gdrive and then enable the two rules already available in "backup" section of your configuration file. With the same logic you can leverage other services or implement your custom logic.
The default command for a cloud backup (cat %filename%| gdrive upload - %taget%) would create on Google Drive a new file every time is run. To have instead a new revision for the same file, first of all upload the file and retrieve its ID by running gdrive list. Then change the command to something like gdrive update 1BzFOaZajFRCYOGZjSTVfU1RF1FU dump.rdb which will create a new revision to an already existing file.
For every sensor configured with "format": "image", it is possible to add both object_detection (to detect specific objects in the picture like faces or bodies) and motion_detection settings (to detect differences between two consecutive images and hence motion).
Object detection is useful when you are looking for specific objects within a single image and want to be e.g. alerted if there is some. I use this feature to detect faces in a picture and being alerted like it was an additional alarm system (motion detection is great but sometimes prone to false positives if the light changes but if there is a face in my house when I'm away there is defintely a serious problem). The engine leverages the Haar Feature-based Cascade Classifier from cv2 (more information on http://docs.opencv.org/2.4/modules/objdetect/doc/cascade_classification.html) and the frontal face cascade is already included in myHouse. Additional objects can be downloaded from https://github.com/opencv/opencv/tree/master/data/haarcascades or with some patience you can create custom object.
The following directives can be used to tune the detection:
                                            "display_name": {
                                                "type": "object",
                                                "description": "The name of the object that will be used within the alert text (for each configured language)",
                                                "minItems": 1
                                            },
                                            "filename": {
                                                "type": "string",
                                                "description": "Name of the haar cascades XML file to use for detecting the object (download more from https://github.com/opencv/opencv/tree/master/data/haarcascades)"
                                            },
                                            "scale_factor": {
                                                "type": "number",
                                                "description": "Parameter specifying how much the image size is reduced at each image scale."
                                            },
                                            "min_neighbors": {
                                                "type": "number",
                                                "description": "Parameter specifying how many neighbors each candidate rectangle should have to retain it"
                                            },
                                            "min_size": {
                                                "type": "number",
                                                "description": "Minimum possible object size. Objects smaller than that are ignored."
                                            },
                                            "max_size": {
                                                "type": "number",
                                                "description": "Maximum possible object size. Objects larger than that are ignored."
                                            }
object_detection is an array so you can detect multiple concurrent objects.
motion_detection can instead be used to detect changes between two consecutive images like a standard webcam would do and a percentage threshold can be set to detection significant motions. It can be configured through the following:
                                        "display_name": {
                                            "type": "object",
                                            "description": "The name of the movement that will be used within the alert text (for each configured language)",
                                            "minItems": 1
                                        },
                                        "threshold": {
                                            "type": "integer",
                                            "description": "The minimum difference in percentage between two images to trigger an alert"
                                        }
And requires at least two images to be retained to find out the differences. This can be achieved with the following retention policy:
          "retention": {
            "realtime_count": 2,
            "realtime_days": 0
          },
Putting all together, to enable face detection and motion detection on a raspberry webcam, you would add the following sensor to your configuration:
        {
          "module_id": "webcams",
          "group_id": "inside",
          "sensor_id": "study_room",
          "enabled": true,
          "display_name": {
            "en": "Study Room"
          },
          "plugin": {
            "plugin_name": "image",
            "command": "raspistill -vf -hf -w 640 -h 480 -o - 2>/dev/null",
            "polling_interval": 7,
            "cache_expire_min": 0
          },
          "format": "image",
          "retention": {
            "realtime_count": 2,
            "realtime_days": 0
          },
          "object_detection": [
            {
              "display_name": {
                "en": "face(s)"
              },
              "filename": "haarcascade_frontalface_alt2.xml",
              "scale_factor": 1.2,
              "min_neighbors": 3,
              "min_size": 10,
              "max_size": 70
            }
          ],
          "motion_detection": {
            "display_name": {
              "en": "motion"
            },
            "threshold": 10
          }
        }
To trigger an alert when something happens, you need also a rule in place which would trigger something is detected. The snippet below would run the same logic for three different webcams, retrieve the latest two images ("image": "%i%,-2,-1") and trigger if both the alarm has been armed (defined through another sensor) and there is any form of detection (the evaluation of "image" would return an empty string if nothing has been detected or the name of the alert otherwise).
        {
          "rule_id": "webcam_monitoring",
          "for": [
            "webcams:inside:first_floor",
            "webcams:inside:study_room",
            "webcams:inside:outdoor"
          ],
          "display_name": {
            "en": "Attention! Detected %image% in the webcam %i%"
          },
          "enabled": true,
          "severity": "warning",
          "run_every": "5 minutes",
          "conditions": [
            "image != no_detection",
            "armed_status == status_on"
          ],
          "definitions": {
            "image": "%i%,-2,-1",
            "no_detection": "",
            "armed_status": "%i%_armed,-1,-1",
            "status_on": 1
          }
        }
Always review the logs in the "logs/myHouse.log" file located within the directory where myHouse resides. Logs are rotated periodically so check which file contains the logs you are looking for.
In your configuration file, look for the "logging" section and change "level" of "myHouse" from "info" to "debug" and restart the service. Logs can become very verbose, ensure to set it back to "info" once finished debugging.
Point your browser to :http://ip/module_id/group_id/sensor_id/timeframe/series_id
If a sensor is using a "pull" type of plugin (e.g. myHouse is supposed to actively retrieve the measure and not viceversa) you can manually query it.
First of all first review https://sourceforge.net/p/my-house/wiki/#plugins to ensure you understand the logic behind.
Then run the following:
sudo python sensors.py <module_id> <group_id> <sensor_id> save
To retrieve the measure, parsing it and save it into the database
If the sensor is using a plugin which support "output", you can manually send e.g. 1 to that module_id/group_id/sensor_id with a URL like the following:
https://myhouse/boiler/main/switch/send/1
By running the following you will get a list of all the keys in the database, the number of entries, the timestamp of thje oldest and newest entry:
sudo python db.py
You can purge out of the database the data belonging to a (myHouse) sensor by running something like:
sudo python db.py delete module_id:group_id:sensor_id
This will delete from the database the key itself which store the current measures and all the other calculated statistics (hour:min, hour:avg, hour:max, hour:rate, day:min, day:avg, day:max, day:rate).
If you don't see any weather statistics showing up and in the logs you find the "not valid due to exceeding rate plan" error, ensure you have registered for a Wunderground API key on https://www.wunderground.com/weather/api/ and update the default key with yours in the configuration file under "plugins", "wunderground", "api_key".
If a map in the UI does not show up and returns a "Oops! Something went wrong" error, ensure you have registered for a Google Maps API key on https://developers.google.com/maps/documentation/javascript/get-api-key and update the default key with yours in the configuration file under "gui", "maps", "api_key".
A generic HTTP plugin has not been implemented since the retrieved HTML would likely require ad-hoc parsing. It is recommended to configure the "command" plugin instead, running wget or curl as "command_poll" and extract the measure by using in "command_parse" a combination of awk, perl, sed, etc. to extract the relevant data from the raw HTML.
There are a number of ways to integrate a ESP8266 (https://en.wikipedia.org/wiki/ESP8266) device with myHouse:
1. Configure the device to report new measures to myHouse by calling the URL http://myhouse/module_id/group_id/sensor_id/set/value (preferred)
2. Deliver a message to a mqtt gateway and configure a sensor with the mqtt plugin subscribing to that topic
3. Have a webserver running on the device and configure myHouse to periodically poll the measure (the device must be always on)
4. Configure the device to send the measure with a UDP broadcast in a format that the "messagebridge" plugin can understand (requires Wirelessthings messagebridge to be installed and running)
5. Write your own plugin to retrieve the measure from the device with the mechanism of your choice
Yes, add a sensor, format "image". Then configure the "image" plugin and set "command" to something like "raspistill -w 640 -h 480 -o -". In this way the command will be run at the configured polling interval and a new snapshot will be stored within the sensor's data. Dont' forget to configure retention policies to keep only 1-2 instances otherwise the database will grow too much
Support for BLE devices has been added in v2.3.
The plugin requires the bluez/bluetooth packages already installed on the system. Please note the installation script is NOT installing this dependency since many people prefer installing the latest version from sources and installing the deb package would mess up everything.
The first step is to gather the data required to configure the sensor in myHouse. By running the plugin without any argument, this will go in discovery mode and for each device will present:
the MAC address
all the value or notification handles
* for each handle, the retrieved hexadecimal value and a conversion into an integer and a string, to facilitate recognizing the data to map
pi@pi:/projects/myHouse $ sudo python plugin_bluetooth.py
Scanning for BLE devices...
Found 1 device(s):
        - Device F6:F7:E0:BC:02:7A:
                 - Value handle 0x0005, value: 00 00, int=0, string=None
                 - Value handle 0x0007, value: 10 00 3c 00 00 00 90 01, int=1152987475304550401, string=None
                 - Notification handle 0x000c, value: 00 12 02 3a 40 02 , int=77346783234, string=None
                 - Notification handle 0x000f, value: ff b8 ff da ff e4 , int=281170031607780, string=None
                 - Notification handle 0x0012, value: 00 01 8e 5f , int=101983, string=None
                 - Notification handle 0x0015, value: 00 ec , int=236, string=None
                 - Notification handle 0x0018, value: 00 07 , int=7, string=None
Once identified the handle storing the information we need (e.g. 0x0015 storing the temperature in .1 celsius), add a sensor to myHouse and configure its plugin with the required data. For example:
"module_id": "test",
  "group_id": "temperature",
  "sensor_id": "bluetooth",
  "enabled": true,
  "display_name": {
    "en": "Bluetooth"
  },
  "plugin": {
    "plugin_name": "bluetooth",
    "mac": "F6:F7:E0:BC:02:7A",
    "handle": "0x0015",
    "handle_type": "notification",
    "transform": "/10",
    "polling_interval": 10
  },
  "format": "temperature",
  "series": [
    {
      "series_id": "avg",
      "type": "spline"
    },
    {
      "series_id": "range",
      "type": "arearange"
    }
  ],
  "summarize": {
    "avg": true,
    "min_max": true
  }
}
In this way every 10 minutes the device at F6:F7:E0:BC:02:7A will be queried for the notification handle 0x0015 and the result will be divided by 10
First of all you need to configure at least one gateway in the configuration file. Go to "plugins", "mysensors" and enable, customize or add a new gateway. Multiple, concurrent gateways are supported, even of the same type.
If, for example, you are using an ethernet gateway, the configuration will look like the following:
    "mysensors": {
      "gateways": [
        {
          "gateway_id": "ethernet_1",
          "hostname": "localhost",
          "enabled": true,
          "gateway_type": "ethernet",
          "port": 5003
        }
      ]
    },
Each type of gateway requires different parameters, review the "config-schema.json" file for more details.
Once configured, restart the service. Upon restart, ensure the communication with the gateway is working fine. Have a look at the logs in "myhouse_directory/logs/myHouse.log", look for plugin_mysensors and check if you see any message from the gateway. You should see something like:
[2017-02-23 19:25:57] [plugin_mysensors.py:283 - process_inbound()] INFO: [serial_1][0] reporting gateway ready
[2017-02-23 19:25:57] [plugin_mysensors.py:242 - process_inbound()] INFO: [serial_1][0][255] presented as S_ARDUINO_REPEATER_NODE
And for each message received by the gateway something like:
[2017-02-23 19:26:30] [plugin_mysensors.py:245 - process_inbound()] INFO: [serial_1][1][0][SET][V_VOLTAGE]: 3.13
This means you can talk with the gateway, messages are received but are not mapped to any myHouse sensor yet.
The next step is to configure the sensor in myHouse. Despite myHouse does support auto ID generation (e.g. when a brand new sensor asks for an ID to the controller, myHouse will provide this information back) but does not implement an auto discovery mechanism (e.g. available sensors will not show up automatically in the UI).
This means you need to configure your sensor in myHouse once you already know its node_id, child_id, expected type and command.
For example for storing battery level from sensor number 2, you have to configure the plugin of a myHouse sensor in this way:
        {
          "module_id": "indoor",
          "group_id": "battery",
          "sensor_id": "bedroom",
          "enabled": true,
          "display_name": {
            "en": "Bedroom"
          },
          "plugin": {
            "plugin_name": "mysensors",
            "node_id": 2,
            "child_id": 255,
            "command": "INTERNAL",
            "type": "I_BATTERY_LEVEL",
            "gateway_id": "ethernet_1"
          },
          "format": "percentage",
          "series": [
            {
              "series_id": "min",
              "type": "spline"
            }
          ],
          "summarize": {
            "avg": true,
            "min_max": true
          }
        },
Since battery level reports come from child_id 255 and using INTERNAL commands of type I_BATTERY_LEVEL, this will map an inbound message from the defined gateway_id into this sensor.
If the mapping will be successful, you will see in the logs just after the previous message something like the following, meaning the measure has been saved:
[2017-02-23 19:26:30] [sensors.py:187 - store()] INFO: [mysensors][humidity][livingroom] (2017-02-23 19:26:30) saving livingroom: 49.0%
Then you can configure your widget to display the data from this sensor, in a timeline chart for example, like any other myHouse sensor.
If you have a sleeping sensor and you want myHouse to queue your messages and deliver them only once the sensor will be awake next, simply add a "queue_size" attribute to your sensor's plugin configuration. The queue size represents how many messages will be queued and delivered to the sensor when reporting its heartbeat next (smart sleep). For example, the below will send a REQ V_STATUS message to the node number 3, child 1, associated to an etherned gateway. The message will not be sent immediately but queued and delivered automatically as the sensor will report to base. A queue size of 1 implies a single message can be queued and a new one will overwrite the previous (useful when you may have multiple on/off actions and you just want to deliver the latest.
          "plugin": {
            "plugin_name": "mysensors",
            "node_id": 3,
            "child_id": 1,
            "command": "REQ",
            "type": "V_STATUS",
            "queue_size": 1,
            "gateway_id": "ethernet_1"
          },
If you want to send a message to a sensor and e.g. control it with a on-off switch, you first need to defined the sensor exactly in the same way as described above but the child_id and command will be the one used to send the message. E.g.
        {
          "module_id": "indoor",
          "group_id": "boiler",
          "sensor_id": "control",
          "enabled": true,
          "display_name": {
            "en": "Boiler control"
          },
          "plugin": {
            "plugin_name": "mysensors",
            "node_id": 2,
            "child_id": 200,
            "command": "REQ",
            "type": "V_CUSTOM"
            "gateway_id": "ethernet_1"
          },
          "format": "int"
        }
This will send a "REQ" "V_CUSTOM" message (the payload is defined by you) to the node_id number 2 of the "ethernet_1" gateway, child_id number 200.
To start testing this manually first you can visit the URL https://myhouse/indoor/boiler/control/send/1 and check in the logs if everything is working fine and the message is passed through.
Then configure a "checkbox" layout in a widget and as "send" action set something like:
"send_on": "indoor/boiler/control/send/1",
"send_off": "indoor/boiler/control/send/0"
This will send 1 or 0 to the url so to automate the process when you move the switch.
