Ship Lock Scheduling Wiki
Scheduling lockages at ship locks with several parallel lock chambers
Status: Beta
Brought to you by:
martin-luy
Locks are intended to lift ships between different water levels. Ships arriving at both sides of a lock should be assigned to lock chambers such that primarily all ships will wait as short as possible. As this problem is NP-hard (proof by reduction to 3-Partition), advanced algorithms are necessary when you have more than a few ships.
This software was initially developed within a project of TU Berlin regarding the Kiel Canal (see http://www.wsa-kiel.wsv.de/ and http://www.wsd-nord.wsv.de/Schiff-WaStr/Schifffahrt/NOK/index.html). More information about that project can be found on the website of the Combinatorial Optimization & Graph Algorithms group.
The code has been extensively documented by Javadoc. Besides, the workflows of the implemented algorithms have been described in detail in the paper of my diploma thesis, see http://martin-luy.de/diploma_thesis.html.
The software can be applied to locks at inland waterways as well as at river mouths, however the following conditions should be met:
Lock chambers:
Ships:
Prioritization of ships:
Positions of ships in lock chambers:
Entrances and leavings of ships into / out of the lock chambers:
In a few steps you will have it running:
(Click on the pictures to enlarge)

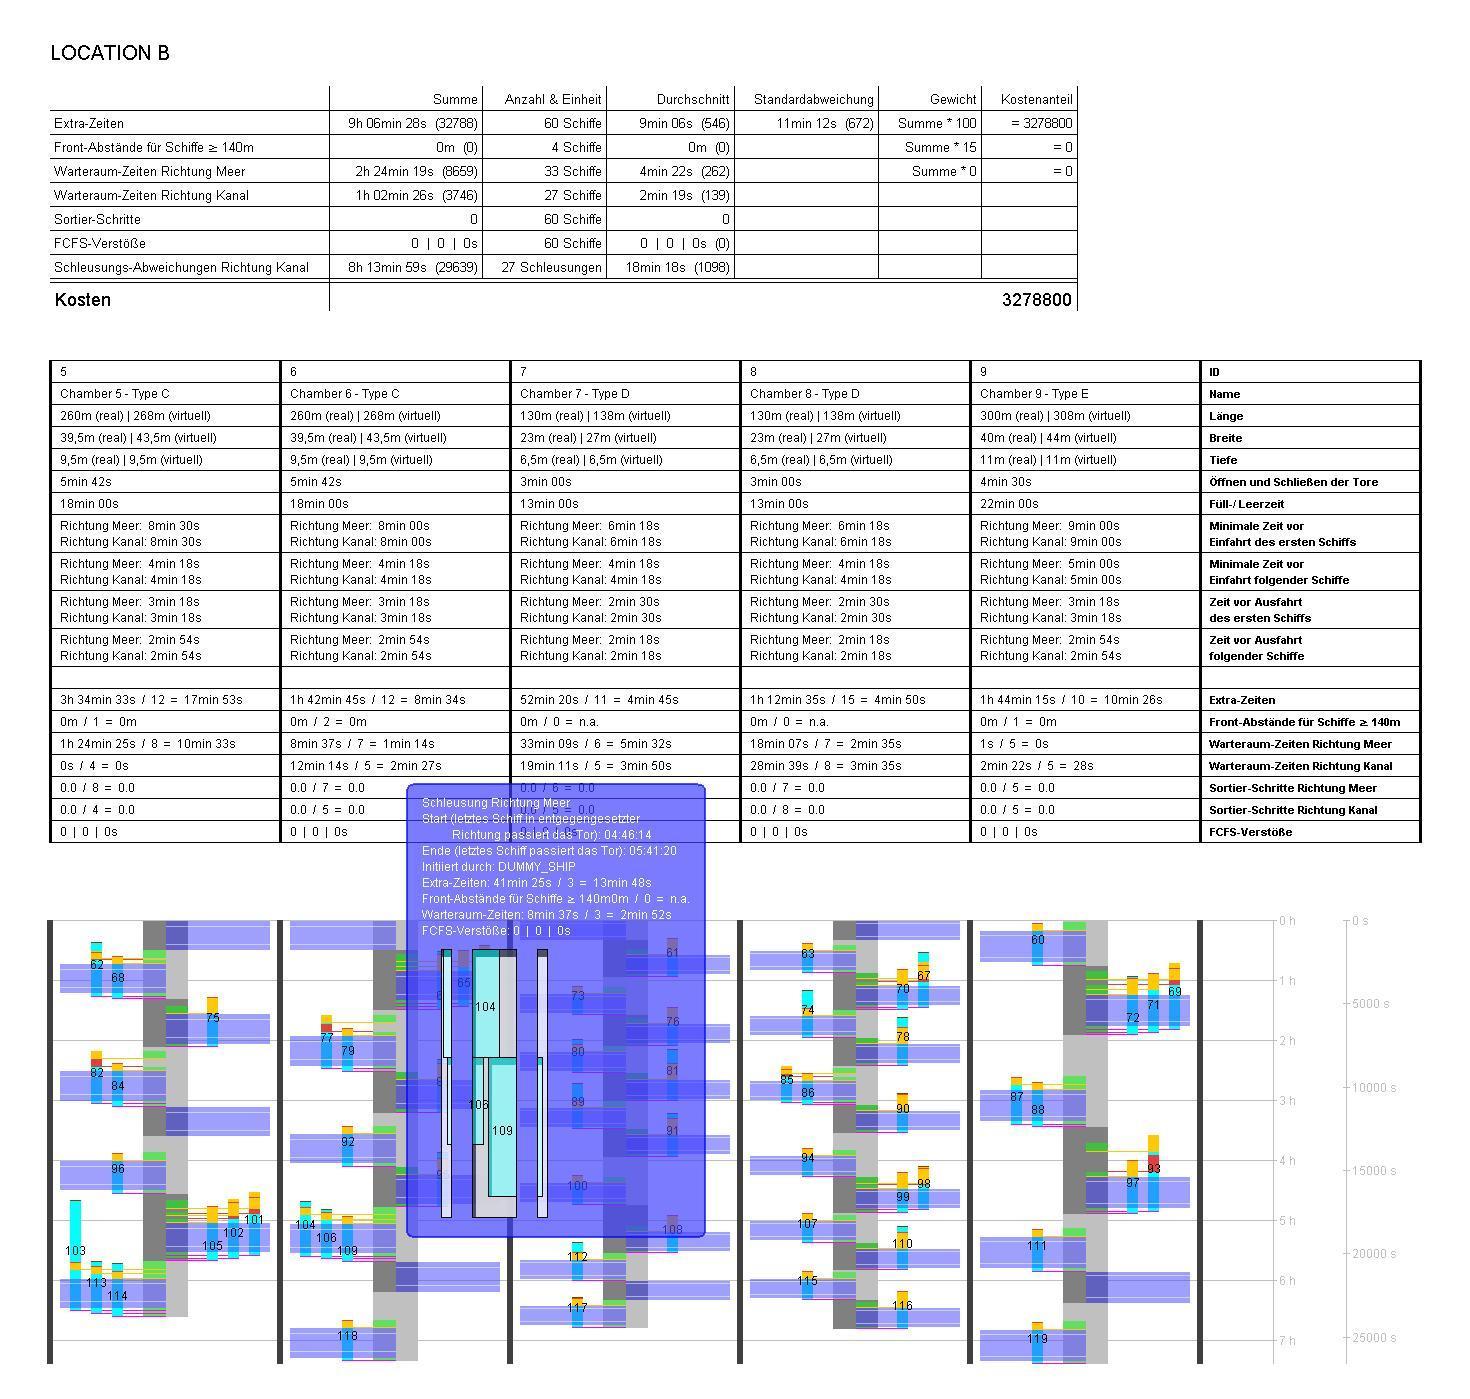
The first table in the display shows the data of the found solution. The second table contains the input data and solution data regarding the lock chambers.
Below, the solution is displayed graphically. The vertical axis shows the time elapsed since some initial point in time. Vertical black lines separate all activities happening at specific lock chambers.
Light blue bars represent the time intervals that are relevant for the ships, i.e. from the arrival at the waiting area until leaving the lock chamber (horizontal pink line). The displayed numbers are the IDs of the ships. The yellow segments illustrate the entrance of the ships into their chamber. Potentially displayed red segments represent the latest time interval for the ship to enter the chamber without delaying the execution of the lockage.
In the middle of each illustration of a chamber there is a vertical bar which shows the activities of the chambers themselves. Light and dark gray segments represent lockages of both directions. The enclosed ships are drawn left or right of the bar accordingly. Ship entrances and leavings will happen in the order from outer to inner.
Dark blue segments represent executions of lockages, i.e. closing the entrance gate, adjusting the water level, and opening the exit gate. These time intervals are separated by two white lines. The green segments (hiding parts of the gray lockage bars) illustrate safety times that must be ensured for a lock chamber before a ship enters or leaves it.
When you click on some of these graphic components, detailed information will be shown. E.g. for the light blue bars of the ships, the entrances of the ships, and the lockage executions. For the gray segments of the lockages, the tooltips will show the positions of the enclosed ships in the lock chamber from top view and from left and right.
This graphic illustrates the local search that was performed by the algorithm for some problem instance. Each node represents some solution. The cost is shown on the vertical axis, and the number of search steps on the horizontal axis. Nodes of neighbor solutions are connected by an edge.
Clicking on a node will open a solution display for that solution. Hovering over some node will show a tooltip with information about that solution.
