#48 graphics - improvements [r874]
Graphics - improvements [r874]
Hi Jim,
Below are the changes.
I think everything is ok.
I hope you will like it.
Respectfully,
Florin Oprea
Speed up graphic programs by (at least) 10%
https://sites.google.com/site/basicbigs/home/Year%207%20basic%20animation.kbs?attredirects=0&d=1
35200ms vs 40000ms (5000 loops)
or http://basic256.blogspot.ro/2012/11/isometric-wave.html
22400ms vs 25400m
or http://users.skynet.be/UglyMike/Basic256/Code/ParticlePointer.kbs
8300ms vs 10500ms (1000 loops)
NEW: SetGraph (Statement)
Format
setgraph
setgraph image_name
Description
All drawing statements refer to the graphic area. This graphic area is by default the on-screen graphic area but this can be changed temporarily with one of the images in the memory.
This allows the user to prepare/draw the images directly in the memory before displaying them on the screen and without worry to exceed the desired drawing area.
Using setgraph without any image_name will switch back to on-screen graphic area.
This statement has an impact on all drawing statements that will draw on the indicated image (PLOT, LINE, RECT, POLY, STAMP, CIRCLE, ELLIPSE, ARC, CHORD, PIE, TEXT, CLG, PUTSLICE, IMGLOAD, IMAGEDRAW, IMAGECENTERED, IMAGETRANSFORMED). Also getting pixels values will be done from the image (IMAGECOPY, PIXEL, GETSLICE, SPRITESLICE, IMGSAVE). GRAPHWIDTH and GRAPHHEIGHT will return the width or the height of the current graphics area (image) and GRAPHSIZE will changes the size of the new graphics area (image).
Example (look at this nice gradients using even circles)
graphsize 520, 260
clg black

map = {{0, 0, 0, 4, 0, 0, 0, 0, 0, 0, 0, 0, 0, 0, 0, 0, 0, 0, 0, 0},{4, 4, 4, 4, 0, 0, 0, 0, 0, 0, 0, 0, 0, 0, 0, 0, 0, 0, 0, 0},{0, 0, 0, 0, 0, 0, 0, 2, 2, 2, 2, 0, 0, 0, 0, 0, 0, 0, 0, 5},{0, 0, 0, 0, 0, 0, 0, 0, 0, 0, 0, 0, 0, 0, 0, 0, 0, 0, 5, 5},{0, 0, 0, 0, 0, 0, 0, 0, 0, 0, 0, 0, 0, 0, 0, 0, 0, 5, 5, 5},{0, 0, 0, 0, 2, 2, 2, 0, 0, 0, 0, 0, 0, 0, 0, 0, 1, 1, 1, 1},{0, 0, 0, 0, 0, 0, 0, 0, 0, 0, 3, 3, 3, 3, 0, 0, 0, 3, 1, 1},{0, 0, 0, 0, 0, 0, 0, 0, 0, 0, 0, 0, 0, 0, 0, 0, 0, 3, 1, 1},{0, 0, 0, 0, 0, 5, 5, 5, 0, 0, 0, 0, 0, 0, 0, 0, 0, 3, 1, 1},{1, 1, 1, 1, 1, 1, 1, 1, 1, 1, 1, 1, 1, 1, 1, 1, 1, 1, 1, 1}}

#create old bricks
bricks = imagenew(26,26)
setgraph bricks
clg darkyellow
penwidth 2
color darkred, rgb(150,20,0)
rect 1,2,22,10
rect -10,15,22,10
rect 16,15,22,10
penwidth 1
for f = 1 to 30
    color darkyellow
    plot rand*26, rand*26
    color darkred
    plot rand*26, rand*26
next f

#glass
glass = imagenew(26,26,blue)
setgraph glass
for x = 40 to 0 step -1
    color rgb(0,0,255-(40-x)*5)
    circle -5, 31, x+4
next x
color 0x60000000
rect 2, 2, 22, 22

#steel platform
steel = imagenew(26,26)
setgraph steel
for x=26 to -26 step -1
    color rgb(128+x*1,128+x*2,128+x*3)
    line x,0,x+26,26
next x
color 0x40000000, clear
rect 0,0,26,26
penwidth 2
plot 3,3: plot 4,23: plot 23,3: plot 23,23

#Air tube
penwidth 1
tube = imagenew(26,26)
setgraph tube
clg 0xff606080
color 0x80ffffff
for x=26 to 0 step -1
    line x,0,x+26,26
next x
color 0x20ffffff
for x=26 to 0 step -1
    line x,0,x-26,26
next x

#boulder
boulder = imagenew(26,26)
setgraph boulder
for x=0 to 21
    color rgb(x*7,x*6,x*3)
    circle 13,13,21-x
next x

setgraph

for y = 0 to 9
    for x = 0 to 19
        a=map[y,x]
        if a= 5 then imagedraw boulder, x*26,y*26
        if a= 4 then imagedraw tube, x*26,y*26
        if a= 3 then imagedraw steel, x*26,y*26
        if a= 1 then imagedraw bricks, x*26,y*26
        if a= 2 then imagedraw glass, x*26,y*26
    next x
next y

NEW: Ellipse (Statement)
Format
ellipse x, y, width, height
ellipse ( x, y, width, height )
Description
Draws the ellipse defined by the given rectangle using the current pen and brush colors.
Example
clg white
color green
ellipse 25,75,160,80
penwidth 5
color orange, yellow
ellipse 100,130,90,60
penwidth 10
color blue, clear
ellipse 130,25,100,200
draws

https://sourceforge.net/p/kidbasic/feature-requests/51/
The suite circle/ellipse is complete:
cicle x, y, radius
arc   x, y, radius, startangle, widthangle
chord x, y, radius, startangle, widthangle
pie   x, y, radius, startangle, widthangle

ellipse x, y, width, height
arc     x, y, width, height, startangle, widthangle
chord   x, y, width, height, startangle, widthangle
pie     x, y, width, height, startangle, widthangle
IMPROVEMENT: Font (Statement)
Format
font fontname, size, weight, italic
font fontname, size, weight
font fontname, size
font fontname
Description
Change the font used by the text command to font_name. If no matching font exists, it will use the closest matching installed font. If font_name is empty ("") then the system-dependent default font is chosen.
The size that the font will be draw on on the screen is defined in points (1/72"). If size is zero or negative, the size of the font is set to a system-dependent default value. Generally, this is 12 points.
The third value represents the line weight (from 1 to 100) used in drawing the text on the screen. A weight of 0 will be thin, whilst 99 will be extremely black. Typical weights are: Thin=0, ExtraLight=12, Light=25, Normal=50, Medium=57, DemiBold=63, Bold=75, ExtraBold=81, Black=87.
The fourth value determines whether the font is italic or not. True value means italic, false means that the font is normal. The default value is false (normal). if is not specified, the default value (false) is used.
This feature makes it possible to use the default font of the operating system using different sizes or bold / italic. In this way applications made with BASIC256 integrates better how the operating system looks like.
Because of this feature (negative font size ad negative font weight) ERRORFONTSIZE and ERRORFONTWEIGHT erros are dropped.
Example
clg
y=10
text 10, y, "This is the default font used by this OS"
y+=textheight

font "Arial", 14, 75, true
text 10, y, "This is ARIAL and ITALIC"
y+=textheight

font ""
text 10, y, "This is the default font used by this OS"
y+=textheight

font "Courier", 16
text 10, y, "This is Courier 16"
y+=textheight

font "", -1, 75
text 10, y, "This is the default font but BOLD"
y+=textheight

y+=20
color gray, clear
rect 5, y+textheight/2, 290, 80
color clear
rect 10, y, textwidth(" This is cool ") ,textheight
color black
text 10, y, " This is cool "

SPEED UP+IMPROVEMENT: GetSlice (Statement)
4200 msec vs 1900 msec (now)
for f=0 to 1000
vals = getslice(0, 0, 300, 300)
next f
print msec
GetSlice now accepts to get the specified rectangle even if it is outside of the original image.
In areas beyond the original image, pixels values (RGB) are set to 0 (transparent)
SPEED UP+IMPROVEMENT: PutSlice (Statement)
54500 msec vs 2339 msec (now)
clg white
fastgraphics
vals = getslice(0, 0, 300, 300)
a=msec
for f=0 to 1000
putslice(0, 0, vals[])
next f
print msec-a
PutSlice now correct draw slice when semitransparent pixels are involved.
clg white
dim arr[100][100] fill 0x40FF0000
putslice 100,100,arr[]
putslice 70,70,arr[]
putslice 40,40,arr[]


PutSlice is also save against list of elements with inconsistent number of elements per row (putslice(0, 0, {{1,2,3},{1,2,3,4}}))
FIX: Line (Statement)
Line is not drawed when destination point is ouside (left-top side). Fixed now.
line 100,100,-10,-10
FIX: Rect (Statement)
Fix Rect bug when negative dimmensions are used.
clg black
color white
rect 100,100,100,100
print pixel(100,100)
clg black
rect 100,100,-100,-100
print pixel(100,100)
color red #make it visible
plot 100, 100
The second rect starts also from point 100,100, but the pixel 100,100 is not white!
-1
-16777216
After fixing bug:
-1
-1
Before (pixel 100, 100 is outside of the rect despite the fact it starts from 100,100):

After:

FIX: ALERT, CONFIRM and PROMPT (Statements) no more update screen (unsolicited)
Program below enable fastgraphics but is not requesting refresh
clg
fastgraphics
circle 150,150,100
color white
font "Arial", 16, 75
text 80, 135, "This is hidden"
Alert "the graphics are hidden"
Before (graphics are showed)

After (correct behaviour)

IMPROVEMENT: Text (Statement)
Format
text x, y, text
text x, y, w, h, text [, alignament]
Description
Paints a text string on the Graphics Output Window at x, y using the current color and font.
If the user specifies only the x and y position, the text will be displayed on a single line.
In this case, this statement does not handle the newline character (chr(10)) so it cannot break text into multiple lines.
If the user specifies the width and height of the rectangle in which want to print the text, then the statement draws the given text within the provided rectangle (w, h) at x, y position.
It draw multiple lines of text with the newline character. The text will be wrapped. If it's impossible to stay within the given bounds, the words will be clipped.
In this case, since the text has a rectangle in which can be displayed, then it is possible to use alignment options.
Example 1
color grey
rect 0,0,graphwidth,graphheight
color red
font "Times New Roman",18,50
text 10,100,"This is Times New Roman"
color darkgreen
font "Tahoma",28,100
text 10,200,"This is BOLD!"

Example 2
font "Arial", 10, 50
color white
rect 10, 10, 200, 200
sometext = "This is the first line." + chr(10) + "This is the second line. Long lines are split at appropriate points, e.g. at word boundaries." + chr(10) + "If the is a long word: that don't fit in width of box, it will be clipped. This is a long word: 1234567890abcdefghijklmnopqrstuvwxyz"
color black
text 10, 10, 200, 200, sometext

#calculate the true dimensions of text box
truew = TextWidth (sometext, 200) #200 is the desired width
trueh = TextHeight (sometext, 200) #200 is the desired width
color black, clear
rect 10, 10, truew, trueh

If you want to know the right size of box to fit the text, you should use TextHeight and TextWidth functions.
Alignament options
The horizontal flags are:
Align Left      0x01    Aligns with the left edge.
Align Right     0x02    Aligns with the right edge.
Align Center    0x04    Centers horizontally in the available space.
Align Justify   0x08    Justifies the text in the available space.
The vertical flags are:
Align Top       0x20    Aligns with the top.
Align Bottom    0x40    Aligns with the bottom.
Align Center    0x80    Centers vertically in the available space.
Example 3
clg
sometext = "This is the first line." + chr(10) + "This is the second line. Long lines are split at appropriate points, e.g. at word boundaries." + chr(10) + "If the is a long word: that don't fit in width of box, it will be clipped. This is a long word: 1234567890abcdefghijklmnopqrstuvwxyz"
color black
text 10, 10, 200, 200, sometext, 2 #Align Right

Example 4
clg darkgreen
Font "Arial", 16, 85
color black, green
rect 25, 50, 250, 100
color black
text 25, 50, 250, 100, "SCORE: 0000231", 0x04|0x80 #Align Center (horizontally and vertically)

IMPROVEMENT: TextHeight (Function)
Format
textheight ( )
textheight ( text, width )
Description
Returns the height of the font in pixels as it would be drawn by the Text statement.
TextHeight can be used also to return the height of the given text in case it will be drawn on multiple lines by the Text statement using a box. In this case, width is the width of the text box.
IMPROVEMENT: TextWidth (Function)
Format
textwidth ( string )
textwidth ( string, width )
Description
Returns the length in pixels of the string as it would be drawn by the Text statement.
TextWidth can be used also to return the true width of the text in case it will be drawn on multiple lines by the Text statement using a box.
In this case, width value is the width of the text box. Returned value can be smaller either bigger than desired box width (long word that ca not be wrapped and it will be clipped)
Printing
Document name in printer queue

PDF properties (Creator)

PrinterOn (Statement)
Format
printeron
printer on
Description
Turns printing on. Once printing is on all the graphics/drawing commands PLOT, LINE, RECT, POLY, STAMP, CIRCLE, ELLIPSE, ARC, CHORD, PIE, TEXT, PUTSLICE, IMGLOAD, IMAGEDRAW, IMAGECENTERED and IMAGETRANSFORMED will draw on the printer page and not the graphics area.
Graphheight, Graphwidth also reports information about the printer graphical page. This is usually smaller than the real paper since the accesible page normally has margins.
CLG will paint the entire page surface whith desired color (even margins). This is usefull to create a cover with a desired color background when printing to PDF file.
Unlike the statement setGraph, IMAGECOPY, PIXEL, GETSLICE, SPRITESLICE, IMGSAVE and GRAPHSIZE will still refer to the graphics area because it is impossible to change the size of page or to receive the content in pixels from it.
Once the printer pages are rendered the printeroff statement sends the print document to the selected printer or to a PDF file. The device and device options can be setup from the Edit/Printer Preferences menu option.
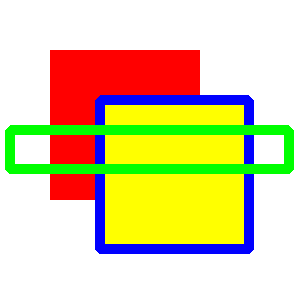
IMPROVEMENT: Rect (Statement)
Format
rect x_position,y_position,width,height
rect x_position,x_position,width,height,rounded
rect x_position,x_position,width,height,x_rounded,y_rounded
Description
Draws a width x height pixel rectangle using the current pen and brush colors. The top left corner is located at x_position,y_position.
If rounded value is given, then it will draws the given rectangle with rounded corners using the specified number of pixel for that (radius).
User can specify also different x_rounded and y_rounded values for more flexible rounded rectangles. x_rounded is the number of pixels of width rounded and x_rounded is the number of pixels of height rounded (x_rounded and y_rounded arguments specify the radii of the ellipses defining the corners of the rounded rectangle)
Example
clg
color red
rect 50,50,150,150
penwidth 10
color blue, yellow
rect 100,100,150,150
color green, clear
rect 10,130,280,40
draws
Example
clg white
color red
rect 50,50,150,150,15       #15 pixels to be rounded
color blue, yellow
rect 100,100,150,150,10,70  #10 pixels on width edge, 70 on height
penwidth 3
color green, clear
rect 10,70,280,200,70,70    #70 pixels to be rounded

ERROR?: Stamp is centered using first point. It would be nice/correct to rotate using center of polygon?
fastgraphics
s=0.5
r=0
tri = {{0, 0}, {100, 170}, {-30, 100}}
loop:
a=key
if a = 16777235 then s=s+0.1
if a = 16777237 then s=s-0.1
if a = 16777234 then r=r+0.1
if a = 16777236 then r=r-0.1
clg blue
color green
text 5,5,"scale: "+s
text 5,15,"rotate: "+r
stamp 150, 150, s, r, tri[]
color red
plot 150,150
refresh
pause 0.02
goto loop
