Menu
▾
▴
[Gnuplot-info] array (ab)use case
|
From: Emanuel B. <in...@da...> - 2022-07-08 04:35:18
|
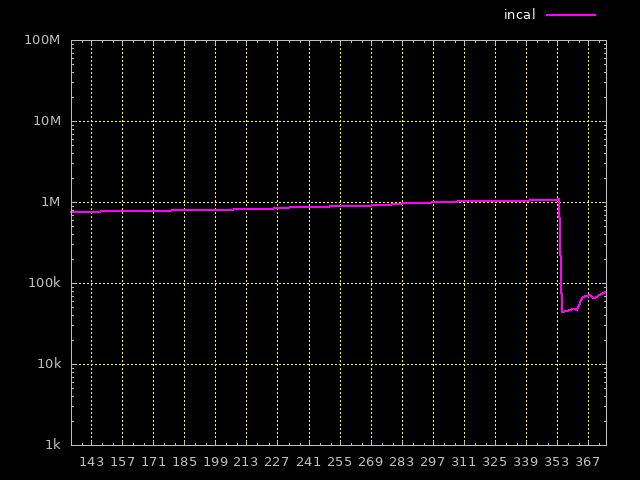
What happened to the colors? I'm using the array in an incorrect way. #! /usr/local/bin/gnuplot # # this file: # https://dataswamp.org/~incal/hits/hits.gpi # # the graph: # https://dataswamp.org/~incal/hits/hits.png reset set term png background rgb "black" set out "/home/incal/public_html/hits/hits.png" set tics font "verdana,10" set format x "%s" timedate set xtics 3,7 set xrange [147:] noextend set format y "%.0s%c" set logscale y set yrange[1000:1e9] set grid lc "yellow" set border lc "gray" set key outside top right spacing 1.4 tc "white" font "verdana,10" horizontal array Cols = ["cyan", "magenta", "yellow", "green", "white", "red"] data="/home/incal/public_html/hits/hits.dat" plot for [i=1:*] \ data u ($0+1):i w l lc Cols[(i % 6) + 1] lw 2 t columnhead -- underground experts united https://dataswamp.org/~incal |
