Menu
▾
▴
Re: [Gnuplot-info] 12M? or 12 000 000? (not 12000000)
|
From: Emanuel B. <in...@da...> - 2022-06-24 08:30:44
|
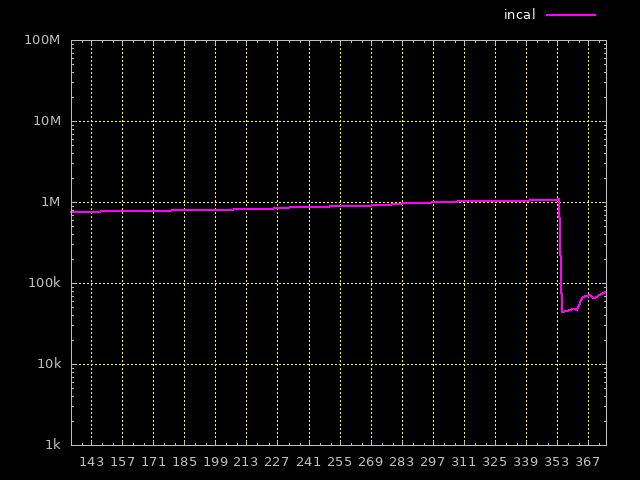
Norwid Behrnd via gnuplot-info wrote: > For two, the user defined additional tic only was set to > show that this possibility (still) is at your disposition. > E.g., to mark a critical threshold like in control charts > (analytical chemistry / chemical engineering), adding > lower/upper control levels before a process runs away. Thus, > it was an alternative to an one-liner like Right, I would have expected such a feature to exist and now you have showed it beyond doubt :) But how will one get infamation on the x-axis? It should start either at 2022-01-10 and then +7 days for every xtick, or it can start with 148 also with +7 days per step. In the shell (shell-mode) it works using 'date +"%Y-%m-%d"' or 'date +"%j"' if that helps ... It would be better to automate it than hard code it but actually hard-code would also be an improvement at this stage. https://dataswamp.org/~incal/hits/hits.gpi https://dataswamp.org/~incal/hits/hits.png -- underground experts united https://dataswamp.org/~incal |
