Menu
▾
▴
gnuplot-info
|
From: Glenn G. <gd...@zp...> - 2022-06-28 15:25:59
|
On Tue, Jun 28, 2022, at 08:52, Emanuel Berg wrote: > Balick, Rebekah C [US] (ES) wrote: > >> Can whomever is in charge of this email list take me off of >> it? I have unsubscribed twice and followed the instructions >> but I am still receiving emails. Please remove me from the >> list. Thank you! > > ... was it _that_ bad? > Imo, yes. I would like to respectfully suggest that this ongoing tutorial discussion be relocated to IRQ or elsewhere. It's pretty noisy and does not seem to contain much of general interest that can't be glened from the docs. Just my 2c, not trying to start a fight. |
|
From: Emanuel B. <in...@da...> - 2022-06-28 15:49:53
|
Glenn Golden wrote: > Imo, yes. I would like to respectfully suggest that this > ongoing tutorial discussion be relocated to IRQ or IRQ haha :) > It's pretty noisy and does not seem to contain much of > general interest [...] This is the user ML or am I mistaken? gmane.comp.graphics.gnuplot.user -- underground experts united https://dataswamp.org/~incal |
|
From: Jeremy N. - ml g. <jn....@wi...> - 2022-06-29 14:52:26
|
On 2022-06-28 16:07, Glenn Golden wrote: > Imo, yes. I would like to respectfully suggest that this ongoing > tutorial discussion be relocated ... This sort of thing is normal on every other -users mail-list I'm on. > It's pretty noisy and does not seem to contain much of general > interest that can't be glened from the docs. As a newcomer to gnuplot, I'm finding it useful, because it gives me concrete things to try, to help me to understand gnuplot better. If no new user ever posts here, what sort of thing would you expect to see? Is IRQ (which I think means "interrupt request" - do you mean some sort of chat thing?) searchable in the same way that mail list archives tend to be? If not, it's no use to anyone other than the participants at the instant in which a discussion takes place. -- Jeremy Nicoll - my opinions are my own |
|
From: Peter R. <p.r...@sh...> - 2022-06-29 19:42:49
|
On 29/06/2022 15:12, Jeremy Nicoll - ml gnuplot wrote: > On 2022-06-28 16:07, Glenn Golden wrote: > >> Imo, yes. I would like to respectfully suggest that this ongoing >> tutorial discussion be relocated ... > > This sort of thing is normal on every other -users mail-list I'm > on. I think the idea of a single mailing list probably reflects gnuplot's age. Other projects I follow tend to have forums with multiple categories like development, using blah-blah, and so on. > > >> It's pretty noisy and does not seem to contain much of general >> interest that can't be glened from the docs. FWIW: I think this mailing list is actually pretty quiet. This flurry of activity on 12M or whatever is the first for quite some while. > > As a newcomer to gnuplot, I'm finding it useful, because it gives > me concrete things to try, to help me to understand gnuplot better. > > If no new user ever posts here, what sort of thing would you expect > to see? > > > Is IRQ (which I think means "interrupt request" - do you mean some > sort of chat thing?) searchable in the same way that mail list > archives tend to be? If not, it's no use to anyone other than the > participants at the instant in which a discussion takes place. I think this is a mistyping of IRC - Internet Relay Chat, a chat tool that was used extensively by Noah but not so much since the 17th century 😁. Hence the "Ha-ha" comment it received. Peter |
|
From: Dave H. <da...@ho...> - 2022-06-29 21:20:08
|
On Wed, 29 Jun 2022, Peter Rockett via gnuplot-info wrote: > I think the idea of a single mailing list probably reflects gnuplot's > age. Other projects I follow tend to have forums with multiple > categories like development, using blah-blah, and so on. Only when they reach a certain threshold of topic divergence. > FWIW: I think this mailing list is actually pretty quiet. This flurry of > activity on 12M or whatever is the first for quite some while. It's about the quietest list I'm on (and I'm on lots); it's just that it wakes up every now and then, and should a newbie then join... > I think this is a mistyping of IRC - Internet Relay Chat, a chat tool > that was used extensively by Noah but not so much since the 17th century > ?. Hence the "Ha-ha" comment it received. Indeed; unless the messages are archived then it's useless. -- Dave |
|
From: Emanuel B. <in...@da...> - 2022-06-30 10:23:20
|
Dave Horsfall wrote: >> I think this is a mistyping of IRC - Internet Relay Chat, >> a chat tool that was used extensively by Noah but not so >> much since the 17th century ?. Hence the "Ha-ha" comment >> it received. > > Indeed But actually IRC isn't dead at all, there are currently 43 979 users globally (on 22 529 channels) on Libera.chat - use the /motd command - Libera, which today is the IRC network of the FOSS world. There are just 16 users on #gnuplot tho. The most 10 most popular channels are 2078 #linux 1820 #libera 1776 #fedora 1606 #python 1491 #kde_ru 1401 #archlinux 1394 #archlinux-cn 1204 #archlinux-cn-offtopic 1002 #neovim 907 #ansible > unless the messages are archived then it's useless. But that's super easy! The IRC clients can do logging so you just do that and then rsync the logs to the web pile. https://libera.chat/ -- underground experts united https://dataswamp.org/~incal |
|
From: Dave H. <da...@ho...> - 2022-07-01 23:36:59
|
On Thu, 30 Jun 2022, Emanuel Berg wrote: [...] > But actually IRC isn't dead at all, there are currently 43 979 users > globally (on 22 529 channels) on Libera.chat - use the /motd command - > Libera, which today is the IRC network of the FOSS world. Thanks for all that info! I might give it a go. -- Dave |
|
From: Emanuel B. <in...@da...> - 2022-07-08 04:27:45
|
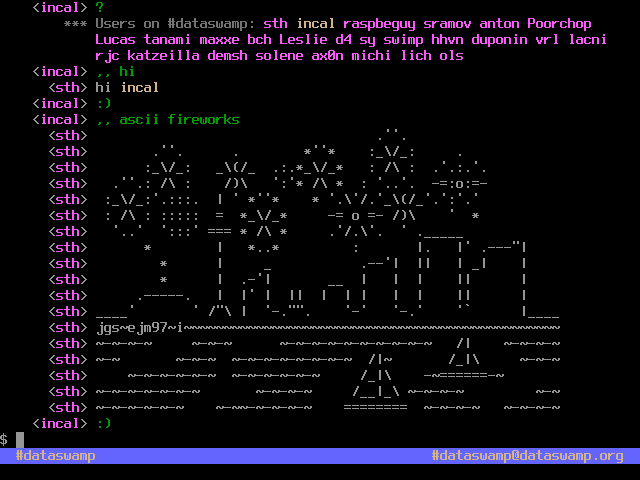
Dave Horsfall wrote: >> But actually IRC isn't dead at all, there are currently >> 43 979 users globally (on 22 529 channels) on Libera.chat - >> use the /motd command - Libera, which today is the IRC >> network of the FOSS world. > > Thanks for all that info! I might give it a go. To Emacs users and I'm sure they are quite a few here I can recommend `erc' (for ERC, Emacs IRC) if anyone is unaware of it. Also built-in in vanilla GNU Emacs is `rcirc' which you get with M-x irc RET. I have no experience from it but my friends on gmane.emacs.help says it's good, and I believe them, however ERC seems more common these days. Here is a screenshot from ERC where a user is executing a bot command to show ASCII art :) from the 90s, right? https://dataswamp.org/~incal/figures/fireworks-over-toronto.png |
|
From: Emanuel B. <in...@da...> - 2022-07-08 04:35:18
|
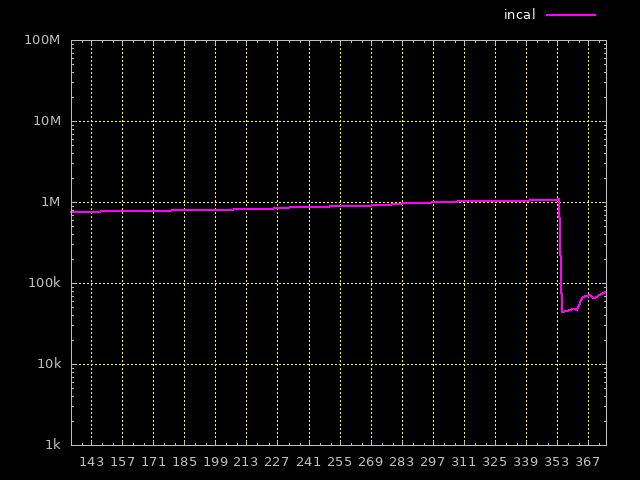
What happened to the colors? I'm using the array in an incorrect way. #! /usr/local/bin/gnuplot # # this file: # https://dataswamp.org/~incal/hits/hits.gpi # # the graph: # https://dataswamp.org/~incal/hits/hits.png reset set term png background rgb "black" set out "/home/incal/public_html/hits/hits.png" set tics font "verdana,10" set format x "%s" timedate set xtics 3,7 set xrange [147:] noextend set format y "%.0s%c" set logscale y set yrange[1000:1e9] set grid lc "yellow" set border lc "gray" set key outside top right spacing 1.4 tc "white" font "verdana,10" horizontal array Cols = ["cyan", "magenta", "yellow", "green", "white", "red"] data="/home/incal/public_html/hits/hits.dat" plot for [i=1:*] \ data u ($0+1):i w l lc Cols[(i % 6) + 1] lw 2 t columnhead -- underground experts united https://dataswamp.org/~incal |
|
From: hchiPer <hc...@gm...> - 2022-07-08 07:08:50
|
Add rgb befor the color name: plot for [i=1:*] \ data u ($0+1):i w l lc rgb Cols[(i % 6) + 1] lw 2 t columnhead Le 8/07/22 à 06:30, Emanuel Berg a écrit : > plot for [i=1:*] \ > data u ($0+1):i w l lc Cols[(i % 6) + 1] lw 2 t columnhead |
|
From: Jeremy N. - ml g. <jn....@wi...> - 2022-07-08 16:22:32
|
On 2022-07-08 05:30, Emanuel Berg wrote: > What happened to the colors? I'm using the array in an > incorrect way. > # this file: > # https://dataswamp.org/~incal/hits/hits.gpi > # > # the graph: > # https://dataswamp.org/~incal/hits/hits.png Every time you post you seem to use the same URLs for the sample data (which is maybe ok if it never changes) and image (which presumably does change through your successive experiments). But that means that someone reading through successive posts you made cannot see what your successive images looked like, just the most recent one. Bear in mind that not everyone reading your posts will necessarily read them on the day you post them. When I post images for other people to view (not yet on this list) I post them with date & time-stamped names & generally leave them online for several years... -- Jeremy Nicoll - my opinions are my own |
|
From: Emanuel B. <in...@da...> - 2022-07-08 07:46:16
|
hchiPer wrote: > Add rgb befor the color name: > > plot for [i=1:*] \ > data u ($0+1):i w l lc rgb Cols[(i % 6) + 1] lw 2 > t columnhead Sweet, that did it! Merci! https://dataswamp.org/~incal/hits/hits.png |
|
From: Emanuel B. <in...@da...> - 2022-07-10 03:31:09
|
Jeremy Nicoll - ml gnuplot wrote: > When I post images for other people to view (not yet on this > list) I post them with date & time-stamped names & generally > leave them online for several years... I saved one, have a look: https://dataswamp.org/~incal/hits/hits-vfork.png LOL But the correct one now looks like this, I think its correct, looks cool, and is automated until 2023 at least :) https://dataswamp.org/~incal/hits/hits.png Or tell me what you think can be improved ... I like forfinements. Err, "hit me"? Source: https://dataswamp.org/~incal/emacs-init/piles.el https://dataswamp.org/~incal/hits/piles-all https://dataswamp.org/~incal/hits/hits.gpi |
|
From: Jeremy N. - ml g. <jn....@wi...> - 2022-07-10 20:01:03
|
On 2022-07-10 04:30, Emanuel Berg wrote: > Jeremy Nicoll - ml gnuplot wrote: > >> When I post images for other people to view (not yet on this >> list) I post them with date & time-stamped names & generally >> leave them online for several years... > > I saved one, have a look: > https://dataswamp.org/~incal/hits/hits-vfork.png > > LOL > > But the correct one now looks like this, I think its correct, > looks cool, and is automated until 2023 at least :) > > https://dataswamp.org/~incal/hits/hits.png I'm not sure if you got the point I was trying to make. If someone tries to read through your older posts following the successive changes you made to your code, they cannot see all the different pictures that you made, because each newer one overwrote the older ones. I'm happy that you managed to get the graph looking how you wanted, but sad that the process isn't so easy for other people to understand. -- Jeremy Nicoll - my opinions are my own |
|
From: Norwid B. <nb...@ya...> - 2022-07-11 08:40:22
|
Jeremy Nicoll wrote: > If someone tries to read through your older posts following the > successive changes you made to your code, they cannot see all > the different pictures that you made, because each newer one > overwrote the older ones. @Jeremy My interpretation of you reply is you recommend snippets of code shared here should be both complete as in «all the relevant instructions to demonstrate the issue» .and. self sufficient for a test run, i.e. to include a minimal set of data to process. In other words, to include gnuplot's datablocks (`$data`) as in e.g., ```gnuplot script $data << EOD 1 2 2 4.5 3 3 4 -1.2 5 0 EOD set terminal pngcairo set output "test.png" set grid plot "$data" w lp pt 2 lc "blue" title "par example" ``` or, considering only a dozen of records of Emanuel's log ```gnuplot script $data << EOD 11814601 737184 610310 13198 4223 1885 11830440 737790 611265 13295 4239 1904 11846530 739535 612274 13396 4264 1918 11861902 742324 613332 13513 4285 1931 11877902 743061 614346 13551 4301 1992 11894437 744473 615366 13609 4318 2290 11910270 745453 616369 13731 9014 4356 11925807 745957 617127 13840 9725 4372 11941696 746489 617887 13952 10055 4387 11958357 748936 618940 14061 10281 4425 11975490 749952 619995 14129 10342 4440 EOD set term png background rgb "black" set out "check.png" set tics font "verdana,10" set format x "%s" timedate set xtics 3,7 set xrange [1:] noextend set format y "%.0s%c" set logscale y set yrange[1000:1e9] set grid lc "yellow" set border lc "gray" set key outside top right spacing 1.4 tc "white" font "verdana,10" horizontal array Cols = ["cyan", "magenta", "yellow", "green", "white", "red"] data= "$data" plot for [i=1:*] \ data u ($0+1):i w l lc rgb Cols[(i % 6) + 1] lw 2 t columnhead ``` @moderators of the mailing list Perhaps the suggest to include small datablocks to render MWE easier to replicate could be included in one of the mails when subscribing to the list. |
|
From: Jeremy N. - ml g. <jn....@wi...> - 2022-07-11 10:33:01
|
On 2022-07-11 09:40, Norwid Behrnd via gnuplot-info wrote: > Jeremy Nicoll wrote: > >> If someone tries to read through your older posts following the >> successive changes you made to your code, they cannot see all >> the different pictures that you made, because each newer one >> overwrote the older ones. > @Jeremy > My interpretation of you reply is you recommend snippets of code > shared here should be both complete as in «all the relevant > instructions to demonstrate the issue» .and. self sufficient for > a test run, i.e. to include a minimal set of data to process. In > other words, to include gnuplot's datablocks (`$data`) as in e.g., > > ```gnuplot script > $data << EOD ... Yes! I presume that gnuplot's output isn't meant to vary much across different OSes, but presumably there can be platform differences not least in the fonts available. So although in theory anyone can test someone-else's code on their own system, it might not follow that weird results that one person gets will also happen for everyone else. That's why I thought that if URLs are given to an OP's image(s) it would be better if different images had different URLs. -- Jeremy Nicoll - my opinions are my own |
|
From: Emanuel B. <in...@da...> - 2022-07-22 02:40:39
|
Jeremy Nicoll - ml gnuplot wrote: > I'm not sure if you got the point I was trying to make. > > If someone tries to read through your older posts following > the successive changes you made to your code, they cannot > see all the different pictures that you made, because each > newer one overwrote the older ones. > > I'm happy that you managed to get the graph looking how you > wanted, but sad that the process isn't so easy for other > people to understand. I understood, don't know if this qualifies as a real problem tho, but if and when I do this again I'll maybe use a filename scheme so that plot-revenge-2022-07-22.png would indicate today's version. -- underground experts united https://dataswamp.org/~incal |

Thanks for helping keep SourceForge clean.
X