Menu
▾
▴

print "";
print $g->loadGoogleChart();
Combo Chart
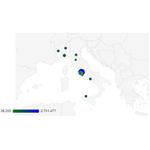
Geo Chart
Table Code
Combo Chart Code
Geo Chart Code
Table With Google Toolbar
Home
Introduction
Inspired by gChartPHP, gChartToolsPHP provide a PHP class library to produce client-side graphs and tables using the Google Chart tools instead of the now deprecated server-side Google Image tools.
All of the current Google Charts are supported. You can see all the different chart tools here
Charts can be embedded into your own pages, or created to appear in an iframe.
Each chart type has an example, run index.html from the examples directory to see the examples for each type, and the associated code to make it work.
In addition, there are phpdocumentor pages in the docs directory
Formatting Data Correctly To Pass To The Chart
There is a consistent format of data that is used when constructing a chart or table. In most cases the format of the chart can be modified simply by changing the visualization. There are 2 elements to the data required. The column formats and the data rows
Column Formats
Each column in the data table is defined by the 6 following elements:
| Element | Description |
|---|---|
| name | The name of the element. This must be unique across all columns. If no label is defined and is required by the chart, the name will be used. Do not use names that may conflict with Javascript language and other variable on the page. |
| type | Type may currently be one of 4 types |
| 1. string - A character variable | |
| 2. boolean - A true/false value | |
| 3. number - An integer or floating point number | |
| 4. date - a PHP date | |
| pattern | If the type is a number, then use standard sprintf formatting |
| If the type is a date, use standard PHP date formatting | |
| id | An ID for the column. If you do not assign one it will automatically be assigned one. |
| label | A label for the column that will appear in the chart/table. |
| p | An array of values to allow the insertion of Column Roles |
Translating Into PHP
Each Column is represented by an array of data, e.g.
array('name'=>'amount',
      'type'=>'number',
      'pattern'=>'$%1.2f',
      'id'=>'',
      'label'=>'Payment Amount',
      'p'=>array()
~~~~~

So In order to define our columns, we would do this:
$cols = array(0=>array('type'=>'string',
'label'=>'Period'),
1=>array('type'=>'number',
'label'=>'Cost',
'pattern'=>'$%1.2f'),
2=>array('type'=>'number',
'label'=>'Profit',
'pattern'=>'$%1.2f'),
3=>array('type'=>'number',
'label'=>'Weather',
'pattern'=>'%1.0fF'),
4=>array('type'=>'boolean',
'p'=>array('role'=>'certainty');
To place our columns into the class, we use **SetAllTableColumns($cols);**.

Adding The Data
---------------
Each Row of data is defined as an array where the first column of data is the **Row Label** e.g.
[0]=>array(row_label,column,column,column),
[1]=>array(row_label,column,column,column));
So our rows look like this:
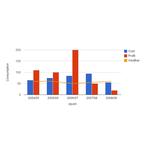
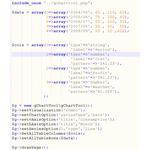
$data = array(0=>array('2004/05', 65 , 110, 60, 1),
1=>array('2005/06', 75 , 100, 60, 0),
2=>array('2006/07', 85 , 200, 50, 0),
3=>array('2007/08', 95 , 50, 55, 0),
4=>array('2008/09', 55 , 20, 60, 1));
To place our columns in the class, we use **SetAllTableRows($data)**


Note that row label is the first column of each row, **NOT** the array index.

Google DataSets
---------------

Alternatively, we can insert our data with a Google DataSet.

Google Datasets look similar to arrays, but are passed in as a single string. Note that the set is **NOT** a JSON encoded PHP array
$data = "[
      ['2004',  1000,      400],
      ['2005',  1170,      460],
      ['2006',  660,       1120],
      ['2007',  1030,      540]
    ]";
~~~~
To place our columns in the class, we use the same syntax SetAllTableRows($data)
Appending Columns
To merge multiple data sets, use the mergeNextDataSet option. see the example combo.php
Retrieving Chart/Table Data Using Ajax
Data for the chart or table can be dynamically fetched using Ajax. The class uses the jQuery library to provide the AJAX functionality, and can be easily modified if required. The necessary jQuery scripts are loaded at run time from google.com, there is no need to download and install the jQuery software.
The method of acquiring data can be broken down into 2 sections, the Client section and the Server section
The Client
include_once "../gcharttool.php";

$g = new gChartTool\gChartTool();
print $g->getGoogleJsapi();

$g->setVisualization('table');
$g->setVisualizationDataSource('ajax');
$g->setChartOption('showRowNumber',true);
$g->setJsonURL('table_json_data.php');
$g->setChartDivId('test_div');
/**

  * We define a div to place the result into
  */
print "<div id=test_div style='width: 500px; height: 300px;'></div>";
print $g->loadGoogleChart();
It is sufficient to set the URL of the PHP program that will supply the JSON data using the setJsonURL method. Any chart options should be defined in the client program, as well as the visualization.
The Server
Using the gChartTool class when writing the server program allows easy aggregation of data to be returned to the client program ijn the correct format, but the server can be a program written in any language. The key is returning the correct formatted data.
~~~~~
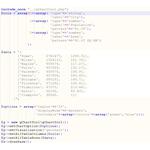
include_once "../gcharttool.php";
$g = new gChartTool\gChartTool();
$data = array(0=>array('Mike', 10000, true),
1=>array('Jim', 8000, false),
2=>array('Alice', 12500, true),
3=>array('Bob', 7000, true));
$cols = array(0=>array( 'type'=>'string',
'label'=>'Name'),
1=>array( 'type'=>'number',
'label'=>'Salary',
'pattern'=>'$%1.2f'),
2=>array( 'type'=>'boolean',
'label'=>'Full Time Employee'));
$g->setAllTableRows($data);
$g->SetAllTableColumns($cols);
print $g->getGoogleLiteralString();
~~~~
As can be seen from the server example, a Server is almost the same as a normal chart program, but instead of creating a chart, it simply returns the data down the standard output.
Fetching Chart/Table Data From A Google Spreadsheet
If you have the rights, you can retrieve the data for the chart by setting the visualizationSource to query, then supplying a spreadsheet name and optionally a query.
Instructions for defining ranges for Google Spreadsheets
$spreadsheet = "https://docs.google.com/spreadsheet/tq?range=A1%3AC5&key=0AhuuLh10Vu1GdFRtdm44QzhGMWFSMTJuN1F6N25TclE&gid=0&headers=1";
$query = "SELECT A,B ORDER BY B";

$g = new gChartTool\gChartTool();
$g->setVisualization('table');
$g->setVisualizationDataSource('query');
$g->setSpreadsheetQuerySource($spreadsheet);
$g->setSpreadsheetQuery($query);
$g->drawPage();
Currently, the class only supports connections where both the data and the labels are supplied for the chart
Methods Associated With Using A Google Spreadsheet
| Method | Parameter | Description |
|---|---|---|
| setVisualizationDataSource | 'query' | Tells the class to you a google spreadsheet as the query method |
| setSpreadsheetQuerySource | string | A Valid Google Spreadsheet URL as described above |
| setSpreadsheetQuery | string | An optional query string, if not set the entire data range |
gChartTool Class Reference
Core Public Methods In The gChartTool Class
This list shows the basic methods required to create a Chart/Table
| Method | Parameter | Description |
|---|---|---|
| drawPage | An all-encompassing function that produces a complete html page, suitable for embedding in an IFRAME | |
| getGoogleJsapi | Returns a string with the html necessary for embedding the necessary external javascripts to produce a chart | |
| getVizualizations | Gets a list of available packages with their Google types and packages. Only one package can be loaded into a single page. This means, for example, that Bar Chart and a Geo Chart cannot be embedded into a single page at the same time. This is a limitation of Google Charts. To avoid this, charts can be embedded into iframes. | |
| loadGoogleChart | Returns a string with the html necessary for creating a Google Chart embedded into your own page. | |
| setAllTableColumns | Sets all table Column Descriptors. The data supplied is a PHP array of data, as described above. | |
| setAllTableRows | array | Sets all table rows. The data supplied can either be a PHP array of data, as described above, or a string containing a Google Dataset. |
| setChartDivId | string | Sets the ID of the Div where a google chart will be presented when acquiring the chart data with Ajax |
| setChartOption | array or string pair | Sets either a single, or array of options that affect the presentation of the graph or table. |
| getGoogleLiteralString | Returns correctly formatted data from an ajax server program to a client | |
| mergeNextDataSet | array | Merges a new set of columns onto the data |
| setSeriesOption | array or string pair | Sets either a single, or array of options that override the default presentation of series elements. A Series is effectively a Column of Data. See the combo.php example for a more detailed explanation |
| sethAxisOption | array or string pair | Sets either a single, or array of options that affect the presentation of the graph horizontal Axis. |
| setJsonURL | string | The URL from which the Chart will receive Ajax data |
| setvAxisOption | array or string pair | Sets either a single, or array of options that affect the presentation of the graph vertical Axis. |
| setVizualization | string | Sets the Type of chart to display, e.g. table, pie, bar, scatter. |
| setVisualizationDataSource | datatable | (default) Tells the chart to use a datatable as the source |
| ajax | Tells the chart to use a URL to get the Chart Data | |
| query | Tells the chart to use a Google Spreadsheet as a data source |
Other Public Methods In The gChartTool Class
This list shows the remaining methods available
| Method | Parameter | Description |
|---|---|---|
| createGoogleDataSet | array | Takes an input array and returns the data as a Google Data Set |
| getChartOptions | Returns an array of all currently set chart options | |
| getDieOnError | Gets whether the class will immediately terminate and dump if an error occurs when creating the chart | |
| gethAxisOptions | Returns an array of all currently set hAxis options | |
| getSeriesOptions | Returns an array of all currently set series options | |
| getTableColumns | Returns an array of the currently set table columns | |
| getvAxisOptions | Returns an array of all currently set vAxis options | |
| getVizualization | Gets the currently set visualization | |
| resetVizualisation | This unsets any chart data and options currently set. Effectively, it is the same as re-instantiating the class | |
| setChartHeight | integer | Sets the chart height. The Parameter is ignored if the Drawpage function is used. |
| setChartWidth | integer | Sets the chart width. The Parameter is ignored if the Drawpage function is used. |
| setIdentifier | string | This appends the string to each chart element and javascript function. This is only necessary if embedding multiple charts into a single page, to prevent duplication of function names. |
See Also [Error Handling]
Adding A Google Toolbar
The Google Toolbar may be added to the chart to allow exporting the chart data to either an HTML page or the CSV files.
The Google Toolbar may only be used when the dataSource is set to Ajax, so naturally the toolbar functionality extends the Ajax Data Client/Server Method.
The Toolbar currently only supports 2 types, html and csv. For each type respectivily, the toolbar appends the values &tqx=out:html; and &tqx=out:csv;
Client Example
~~~~~
include_once "../gcharttool.php";
$tComponents = array(0=>array('type'=>'html','datasource'=>'table_toolbar_json_data.php'),
1=>array('type'=>'csv','datasource'=>'table_toolbar_json_data.php'));
$g = new gChartTool\gChartTool();
print $g->getGoogleJsapi();
$g->setVisualization('table');
$g->setVisualizationDataSource('ajax');
$g->setChartOption('showRowNumber',true);
$g->setJsonURL('table_json_data.php?method=chart');
$g->setChartDivId('test_div');
$g->setToolbarDivId('toolbar_div');
$g->setAllToolbarComponents($tComponents);
print "
";print "";
print $g->loadGoogleChart();
Server Example
--------------
include_once "../gcharttool.php";
$g = new gChartTool\gChartTool();
$data = array(0=>array('Mike', 10000, true),
1=>array('Jim', 8000, false),
2=>array('Alice', 12500, true),
3=>array('Bob', 7000, true));
$cols = array(0=>array( 'type'=>'string',
'label'=>'Name'),
1=>array( 'type'=>'number',
'label'=>'Salary',
'pattern'=>'$%1.2f'),
2=>array( 'type'=>'boolean',
'label'=>'Full Time Employee'));
$g->setAllTableRows($data);
$g->SetAllTableColumns($cols);
if (!array_key_exists('tqx',$_GET)){
print $g->getGoogleLiteralString();
exit;
}
switch($_GET['tqx']){
case 'out:html;':
?>
<style><br>
body {<br>
background:yellow;<br>
}<br>
table {<br>
border:1px solid black;<br>
border-collapse:collapse;<br>
}<br>
td {<br>
border:1px solid black;<br>
}<br>
th {<br>
background:navy;<br>
color:white;<br>
}<br>
</style>
<?php
    print $g->getToolBarDataAsHTML();
    break;
case 'out:csv;':
    header('Content-type: text/csv');
    header('Content-Disposition: attachment; filename="toolbar_data.csv"');

    print $g->getToolBarDataAsCSV();
    break;
}
?>
~~~~
Public Methods Associated With The Google Toolbar
| Method | Parameters | Description |
|---|---|---|
| getToolbarDataAsCSV | Returns the current chart data as a CSV format file | |
| getToolbarDataAsHTML | Returns the current chart data as an HTML Table | |
| setAllToolbarComponents | Array | Set All Toolbar Components |
| setNextToolbarComponents | Array | Sets the Next Toolbar Component |
| setToolbarDivId | string | The ID of the DIV where the toolbar will appear |
Error Handling
Error handling is controlled by the setErrorLevel method. The class supports error levels
| Level | Value | Description |
|---|---|---|
| GCHARTTOOL_ERROR_IGNORE | 0 | Ignores any errors found in the chart data. The chart may fail to display with or without errors. |
| GCHARTTOOL_ERROR_WARN | 1 | Saves any errors that occur on validation. The last error is displayed when the chart is displayed. The chart may fail to display with or without errors. |
| GCHARTTOOL_ERROR_STOP | 2 | The class stops immediately, displaying the error as well as a dump of the chart class. |
Public Methods Associated With Error Handling
| Method | Parameters | Description |
|---|---|---|
| getErrorLevel | Gets the currently set error level | |
| getLastError | Gets the last error message | |
| setErrorLevel | level | Sets the error level for the chart validation. See the information above for the effect of setting the error level. |

Combo Chart

Geo Chart

Table Code

Combo Chart Code

Geo Chart Code

Table With Google Toolbar
Project Admins:
