The project is now hosted on github:
https://github.com/yanqi27/core_analyzer.git
Core analyzer is a power tool to debug memory issues. With ever increasing complexity and dataset size of application programs, it is very challenging to find the root cause of a memory bug. Programmers often use debugger to go through many contexts or data objects in order to hunt down a suspicious variable or object. However, the task is boring, prone to error and usually fruitless. By parsing a core dump file or a live process's memory, core analyzer is able to scan the target's heap data for memory corruption, search the whole address space for data object's references, or analyze memory pattern. It is thorough, labor-free, and insightful. I use the tool on daily basis and it is proved to be invaluable to debug many tough issues.
The tool supports x86_64 architecture including Windows/RedHat/SUSE/MacOSX (32-bit and 64-bit).
For more information, please see the project's web site
Features
- Check heap data structures for memory corruption
- Search all thread contexts, global variables, and heap objects for references to corrupted memory
- Find potential access to victim data through any levels of indirection
- Assist debugging highly optimized code
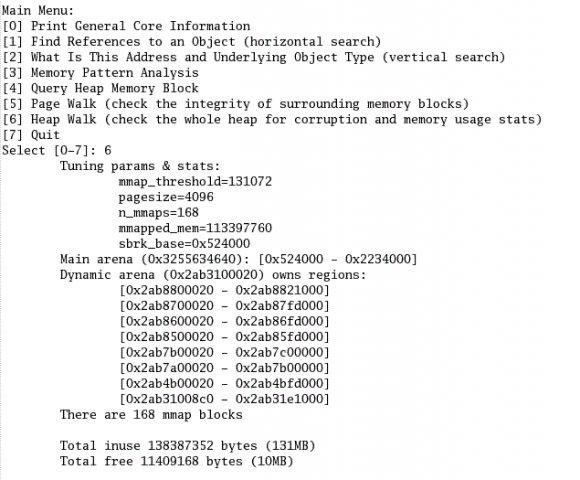
- Analyze memory usage and find the top memory consumer
- Discover shared objects among threads for potential race condition
- Seamless integration to gdb and Windbg debuggers
- Support python extension of gdb
Project Samples


Categories
DebuggersUser Reviews
-
Highly recommend this tool for debugging memory leaks from a core file. It can dump all allocations in the heap among other things. If you regularly debug complex core files, this is a must have. (Note: I used the Linux command line version.)
-
This tool is truly a wonderful tool for analyzing coredump, especially memory related errors. It is able to reveal much valuable info from core file which GDB can't. It's a complementary tool to GDB. I strongly recommend this tool.