We are trying to figure out all of the options of CiteSpace (using
references as nodes) on a small dataset we created with two citing articles
that each contain the same 10 cited references. We have set all parameters
as 'expansive' as possible: top 100% of cited articles, k=100, no
thresholds for c, cc and ccv for all 3 time slices, one time slice for all
years. So we would expect a visualization containing 10 nodes with 45
edges. But we only get 8 nodes visualized with (of course) 28 edges. Could
you please explain this? Where does it get that 'Largest CC:8 (80%)'? You
would save us (and maybe others) a lot of time if you could quickly explain
this. Thanks much!
What are the values of Network: N=? and E=? in the signature of the upper left corner? If it says 8 accounts for 80%, that means the network does have 10 nodes in total. The 20% that is not shown because the default setting shows the LCC initially only. To view all the nodes, menu Filters > uncheck Show the Largest Connected Component Only.
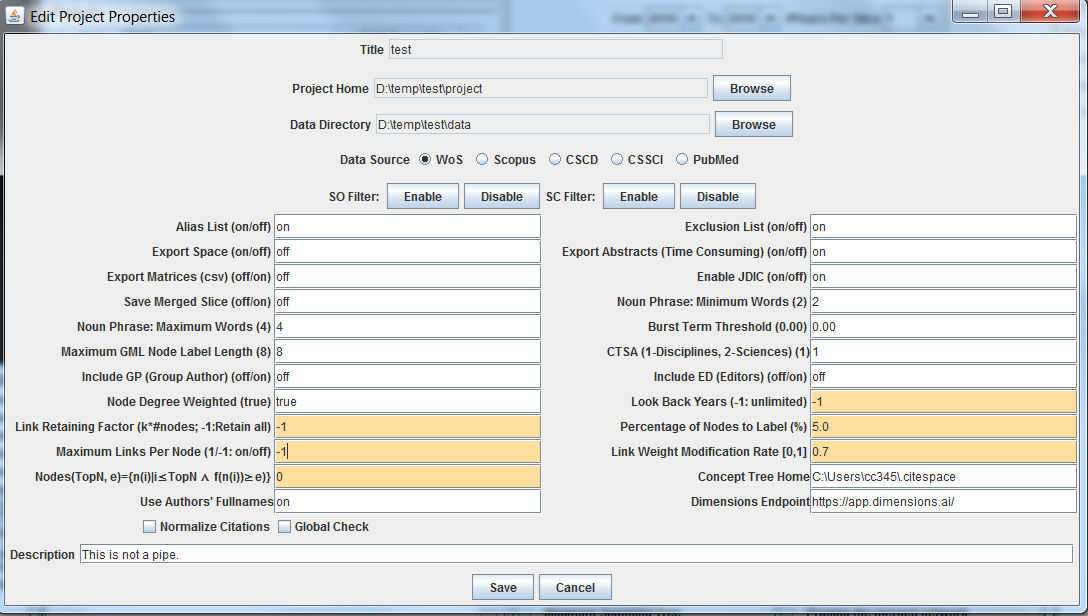
To have an all-inclusive and all-visible network, check the following settings: Project > Edit Properties:
Link Retaining Factor: -1
Nodes (e): 0
Look Back Years: -1 Selection Criteria:
Top N%=100
The maximum number of selected items per slice: make this large enough to cover, e.g. the total number of records
**Filter: **
Show the Largest Connected Component Only: Off
Let me know how it goes.
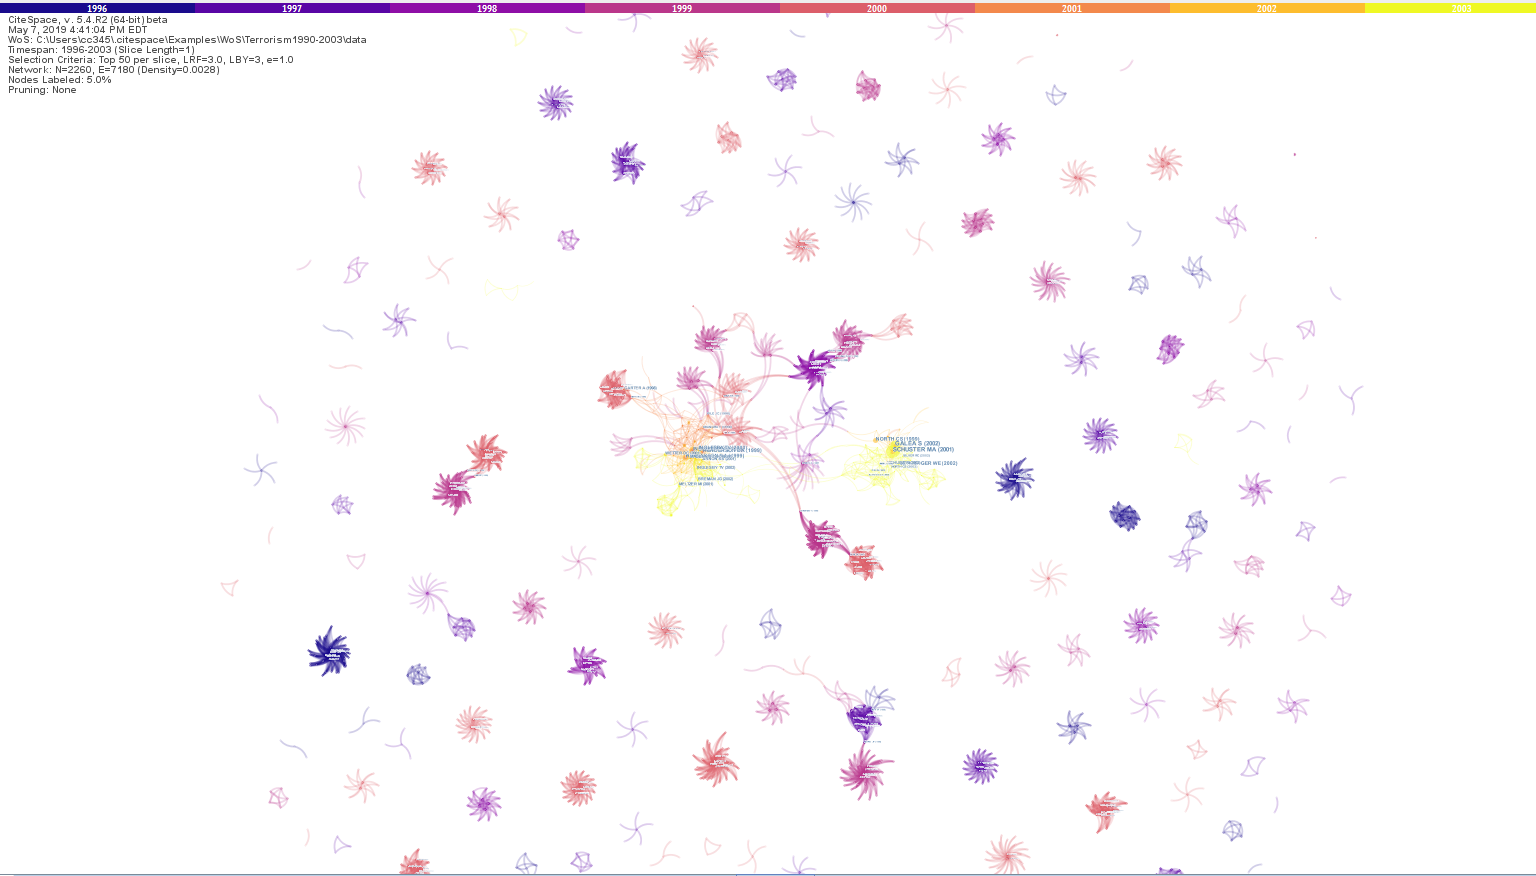
Here is an example when the Show Largest Connected Component Only is turned off.
Last edit: Chaomei Chen 2019-05-07
If you would like to refer to this comment somewhere else in this project, copy and paste the following link:
Thanks for getting back to us. But unfortunately, that still doesn't seem to do the trick. Here are the settings we used:
But as you can (hopefully) tell, CS still only visualizes 8 nodes. BTW, if you want to replicate this, here are the files we used.
Last edit: Stephan De Spiegeleire 2019-05-07
If you would like to refer to this comment somewhere else in this project, copy and paste the following link:
Yes, there is indeed another reason - I forgot about it myself until I checked the code. There is a filter that caps the number of links a node may have. In the current version, it is set at no more than 75% of the total number of nodes, which explains why 8 nodes get connected to each other. The two isolated nodes are there. Move the node size slider with a black background, you should be able to see all 10 nodes but less than 45 links for the above reason. In a larger and more realistic dataset, link weights would be typically different enough so that stronger links are retained. The end users currently cannot change this setting. I will add a user control to the Edit Properties in the next version.
Here is what it looks like if the filter is turned off:
Last edit: Chaomei Chen 2019-05-08
If you would like to refer to this comment somewhere else in this project, copy and paste the following link:
Thanks much! And yes - that one looks perfect. We look forward to being able to generate similar vizzes in a next version - also for much bigger and more realistic datasets.
We do realize that this is not a 'realistic' dataset - but we just kept it artificially small to be able to fully understand how CiteSpace works. And we just didn't understand why those 8 (and not the other two) were selected AND/OR why not all edges were displayed. But so now we do understand and look forward to being able to also change that setting.
And just to be clear - our main intent is to really map the entire 'knowledge landscape' for the topics we're interested in. We'd rather wait longer to see everything, than being more computationally efficient at the expense of missing potentially important nodes. And so this limited example suggested to us that that restriction (capping the number of links a node may have to no more than 75% of the total number of nodes) was just too random: why those 8 and not those two? But I do get your point that in more 'realistic' datasets, this choice to just retain the strongest links MAY make sense. And many (maybe even most) users of CiteSpace may be happy with that restriction. But we'd much rather have the option to look at the results both ways - both WITH that restriction and without.
But please rest assured that we remain great fans of the program AND of your efforts to give us as users the greatest freedom possible to adjust all parameters! So thanks much for clearing this up and for giving us this additional option in the next version.. [Oh and BTW one more comment: I myself am still having problems getting the graph visualization in the center of that window. I'm not sure whether this is due to the fact that I have an ultrawide monitor or not. But all I can say is that, for instance, for that viz I copied in the previous message, I had to look all over the place to 'find it'. It really would be great to have a button to put the entire graph viz in the center of the window]
👍
1
Last edit: Stephan De Spiegeleire 2019-05-08
If you would like to refer to this comment somewhere else in this project, copy and paste the following link:

We are trying to figure out all of the options of CiteSpace (using
references as nodes) on a small dataset we created with two citing articles
that each contain the same 10 cited references. We have set all parameters
as 'expansive' as possible: top 100% of cited articles, k=100, no
thresholds for c, cc and ccv for all 3 time slices, one time slice for all
years. So we would expect a visualization containing 10 nodes with 45
edges. But we only get 8 nodes visualized with (of course) 28 edges. Could
you please explain this? Where does it get that 'Largest CC:8 (80%)'? You
would save us (and maybe others) a lot of time if you could quickly explain
this. Thanks much!
Kindest regards,
-Stephan
What are the values of Network: N=? and E=? in the signature of the upper left corner? If it says 8 accounts for 80%, that means the network does have 10 nodes in total. The 20% that is not shown because the default setting shows the LCC initially only. To view all the nodes, menu Filters > uncheck Show the Largest Connected Component Only.
To have an all-inclusive and all-visible network, check the following settings:
Project > Edit Properties:
Link Retaining Factor: -1
Nodes (e): 0
Look Back Years: -1
Selection Criteria:
Top N%=100
The maximum number of selected items per slice: make this large enough to cover, e.g. the total number of records
**Filter: **
Show the Largest Connected Component Only: Off
Let me know how it goes.
Here is an example when the Show Largest Connected Component Only is turned off.
Last edit: Chaomei Chen 2019-05-07
Thanks for getting back to us. But unfortunately, that still doesn't seem to do the trick. Here are the settings we used:


But as you can (hopefully) tell, CS still only visualizes 8 nodes. BTW, if you want to replicate this, here are the files we used.
Last edit: Stephan De Spiegeleire 2019-05-07
Yes, there is indeed another reason - I forgot about it myself until I checked the code. There is a filter that caps the number of links a node may have. In the current version, it is set at no more than 75% of the total number of nodes, which explains why 8 nodes get connected to each other. The two isolated nodes are there. Move the node size slider with a black background, you should be able to see all 10 nodes but less than 45 links for the above reason. In a larger and more realistic dataset, link weights would be typically different enough so that stronger links are retained. The end users currently cannot change this setting. I will add a user control to the Edit Properties in the next version.
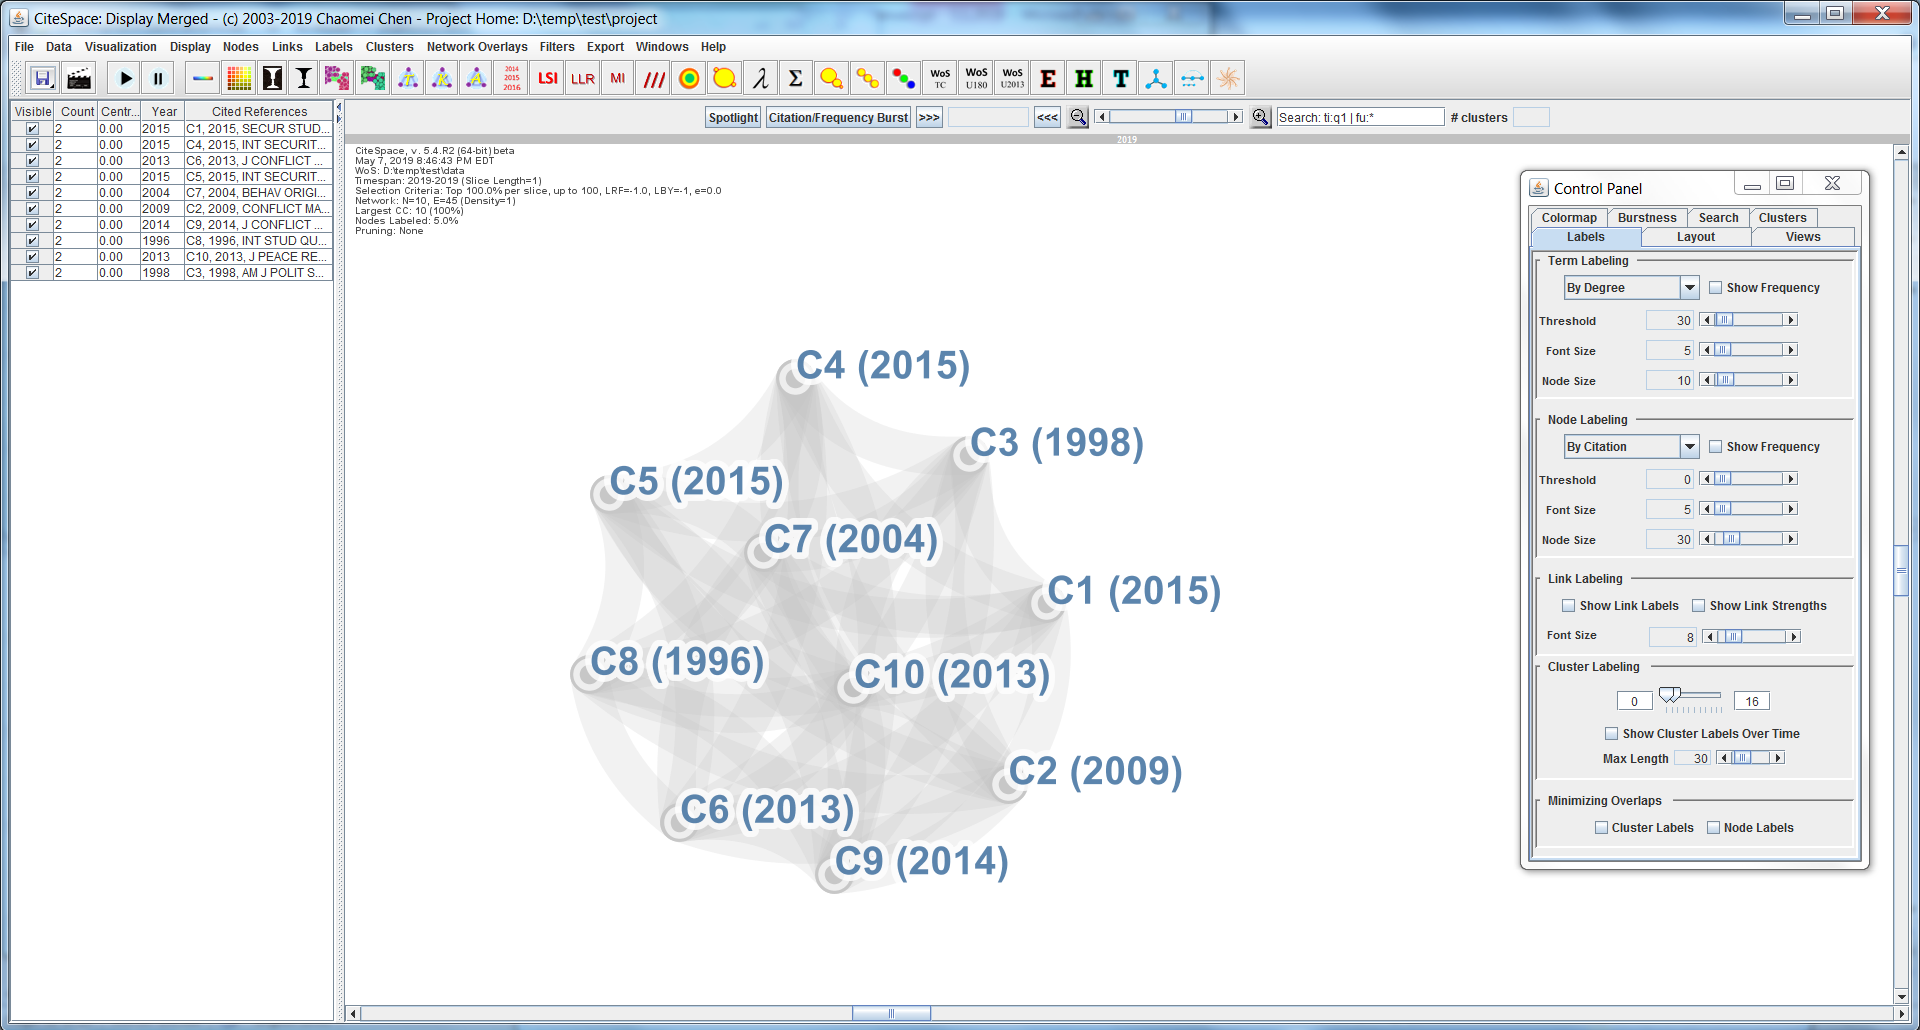
Here is what it looks like if the filter is turned off:
Last edit: Chaomei Chen 2019-05-08
Thanks much! And yes - that one looks perfect. We look forward to being able to generate similar vizzes in a next version - also for much bigger and more realistic datasets.
We do realize that this is not a 'realistic' dataset - but we just kept it artificially small to be able to fully understand how CiteSpace works. And we just didn't understand why those 8 (and not the other two) were selected AND/OR why not all edges were displayed. But so now we do understand and look forward to being able to also change that setting.
And just to be clear - our main intent is to really map the entire 'knowledge landscape' for the topics we're interested in. We'd rather wait longer to see everything, than being more computationally efficient at the expense of missing potentially important nodes. And so this limited example suggested to us that that restriction (capping the number of links a node may have to no more than 75% of the total number of nodes) was just too random: why those 8 and not those two? But I do get your point that in more 'realistic' datasets, this choice to just retain the strongest links MAY make sense. And many (maybe even most) users of CiteSpace may be happy with that restriction. But we'd much rather have the option to look at the results both ways - both WITH that restriction and without.
But please rest assured that we remain great fans of the program AND of your efforts to give us as users the greatest freedom possible to adjust all parameters! So thanks much for clearing this up and for giving us this additional option in the next version..
[Oh and BTW one more comment: I myself am still having problems getting the graph visualization in the center of that window. I'm not sure whether this is due to the fact that I have an ultrawide monitor or not. But all I can say is that, for instance, for that viz I copied in the previous message, I had to look all over the place to 'find it'. It really would be great to have a button to put the entire graph viz in the center of the window]
Last edit: Stephan De Spiegeleire 2019-05-08
I am uploading the new version 5.4.R3 with a quick fix for now. I will add that button soon...
Wow :) ! Thanks!
Trying out the new version. The network modelling is taking a LOT longer than before...
Correction: it DOES work now. So thanks so much, Chaomei!

Last edit: Stephan De Spiegeleire 2019-05-08
Thanks for various feedback, Stephan. I am going to travel soon. Let me take care of it afterwards.
Update (confirmed by a number of our team members) - the new version now doesn't process bigger projects anymore.
I just uploaded a new version. Do you want to try it?
Yes - we seem to be back in business. Thanks!