CiteSpace Blog
A widely used tool for visual exploration of scientific literature.
Brought to you by:
citespace
CiteSpace allows users to analyze bibliographic records from Dimensions in two ways:
This is a direct DSL search for publications in the journal Scientometrics.
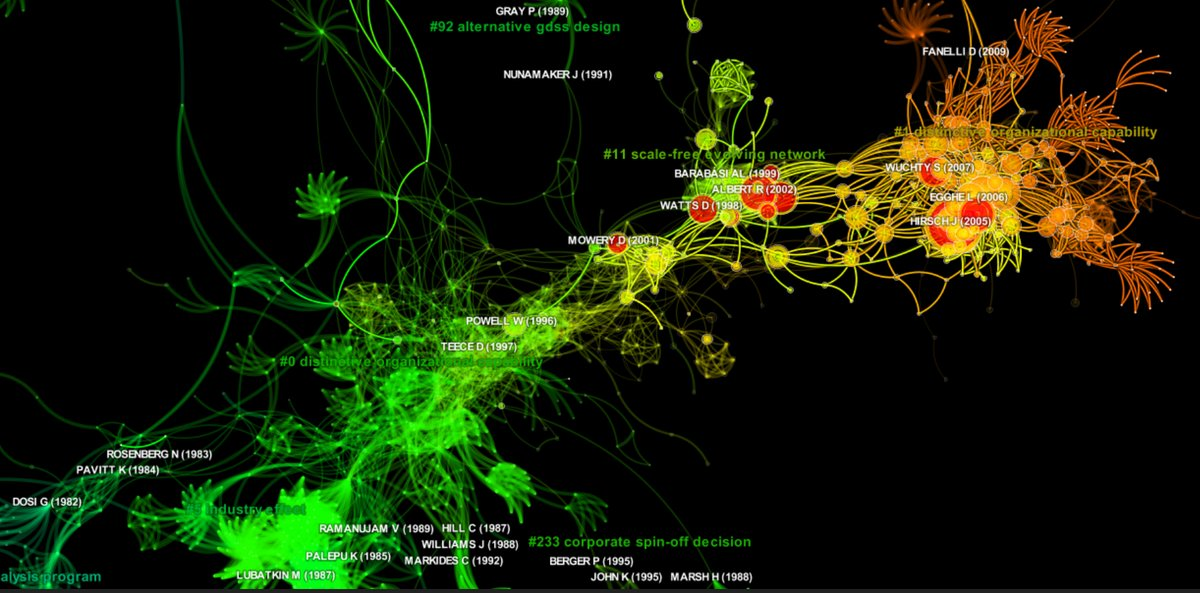
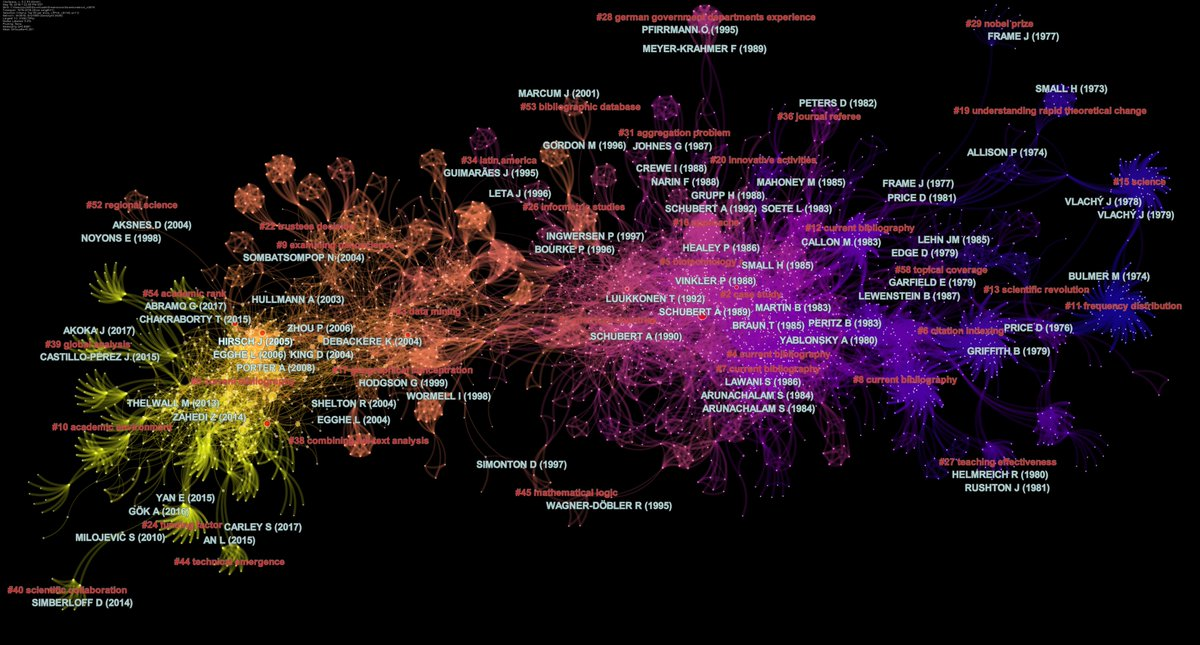
This is a local view of a network generated with cascading citation expansion. Links in the green areas are more blurry than links in the orange areas. The more prominent links are from the original search and the less prominent ones, i.e. the blury ones, are resulted from the cascading citation expansions, indicating they are beyond the scope of the original search.
Chen, C. (2018) Cascading Citation Expansion. Journal of Information Science Theory and Practice 6 (2), 6-23.
https://www.researchgate.net/profile/Chaomei_Chen/publication/325581679_Cascading_Citation_Expansion/links/5b1709c345851547bba32a98/Cascading-Citation-Expansion.pdf
The second option is simple and straightforward. You should probably start it from here if you are not familiar with the DSL query language or do not need to use cascading citation expansion functions.
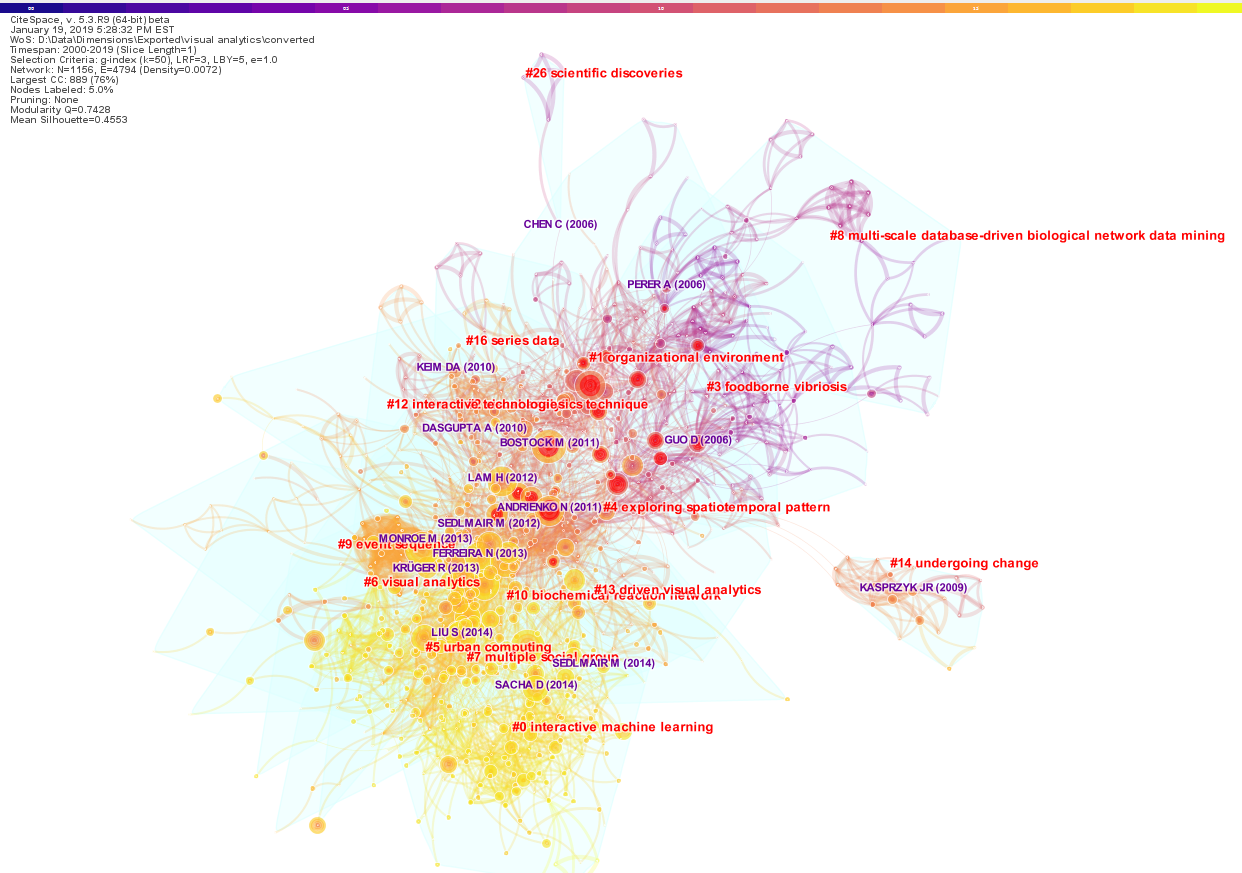
This is a network of co-cited references based on a search for "visual analytics" on Dimensions. The data file is exported in CSV and converted in CiteSpace: Data > Import/Export > Dimensions.
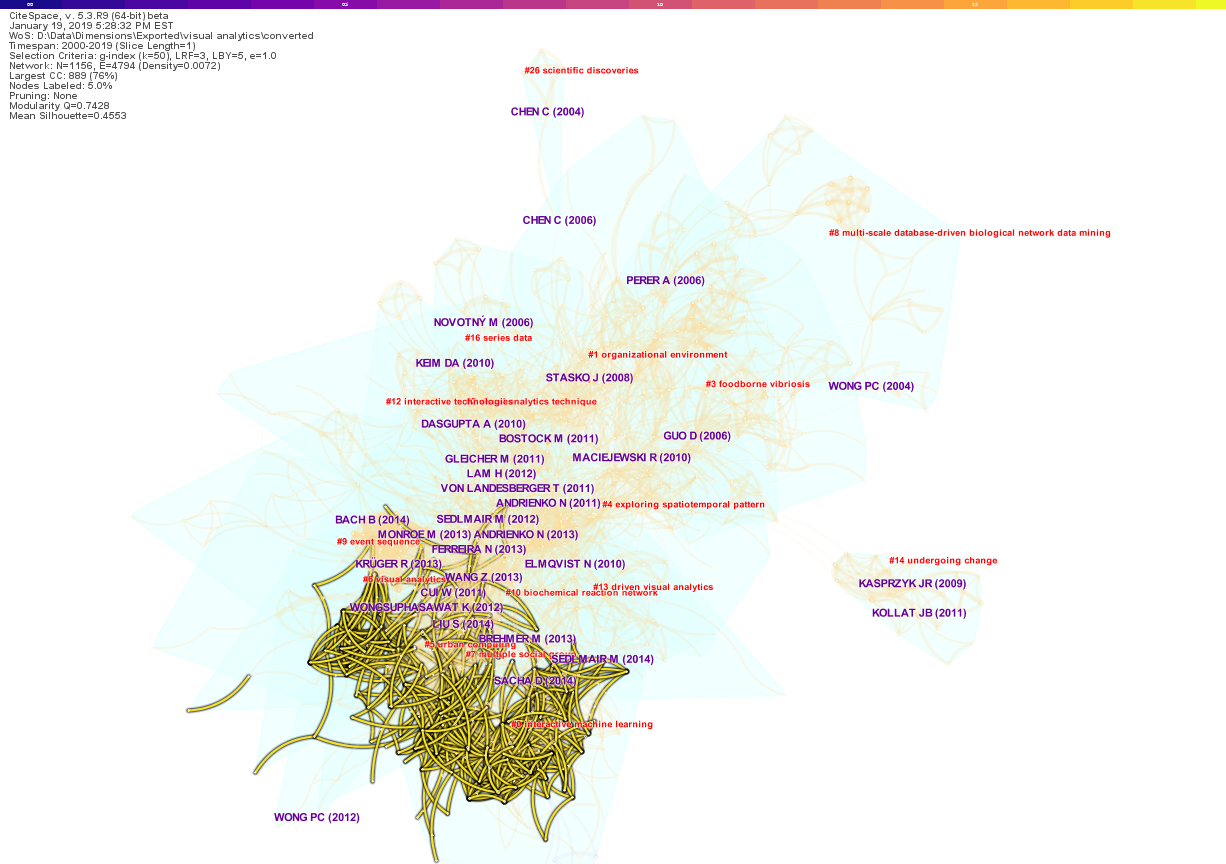
This is the same network with a link walkthrough. The highlighted links are added by articles published in 2018. The link walkthrough allows the user to step through the network one year at a time.
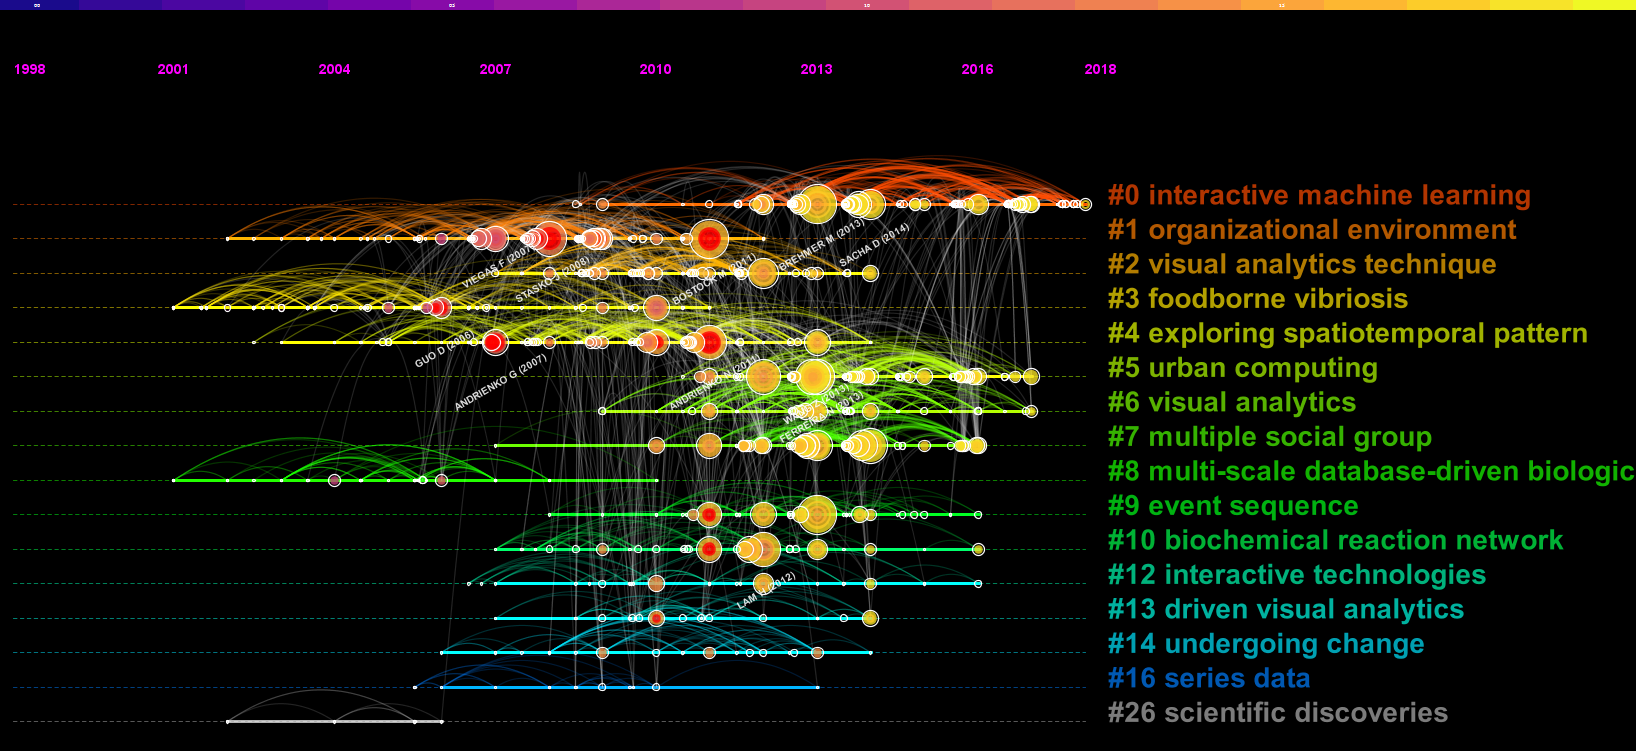
This is the timeline visualization. References with strong citation bursts are shown with red rings and their corresponding labels. The time flys from the left to the right.
See also a blog by https://www.dimensions.ai/2019/01/2018-dimensions-research-roundup