Ardamon Wiki
Arduino-controlled thermostat and sensors management
Status: Beta
Brought to you by:
wpierre
Ardamon manages sensors and every sensor is bound to one sensor type.
Why this ? Because different kind of sensors have different behaviors, units and values. Therefore, it's useful to group them by their type.
Example :
Let's say you're using Ardamon to build a little weather station. You'll have several temperature sensors, a pressure sensor and say, a humidity sensor. Temperatures are expressed in degrees (Celcius or Farenheit), pressure is expressed in hPa and humidity is expressed in percents.
You can't mix up every values in differents units in the same graph and differents units have differents ranges. Let's pretend we'll show both tempeatures (Celcius) and pressure on the same graph. Temperatures are usually ranged between -20°C (cold winter in Western Europe) and +40°C (hot summer in Western Europe). Pressures are ranged between extreme values of 870 hPa and 1083 hPa, according to the Wikipedia Atmospheric pressure page : http://en.wikipedia.org/wiki/Atmospheric_pressure.
If you show both on a graph, the pressure will be well displayed, but you could have a 50°C amplitude for the temperature serie, it would still look like a horizontal line.
Sensor types are also used for grouping several sensors according to the source, ie : You gather the temperature of several rooms of your home on one hand (warm temperatures that should normally stay between 15°C and 30°C) and on the other hand, gather some "cold temperatures" coming from the outside of your home, a shack in the garden and so on with temperatures going from -20°C to +50°C. You can create two different sensor types, one for inside and another for outside and have two separate graphs showing both groups.
Just click on the up-rightmost button on the Ardamon main page :

It will open up this page :
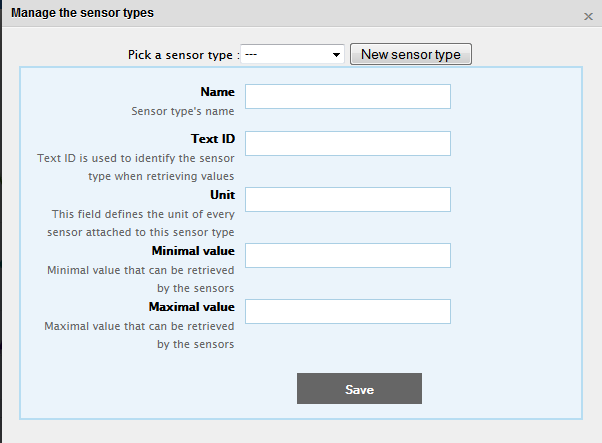
Click on the "New sensor type" button.
Fill up the fields with the desired values (we'll take a temperature sensor type as example):
Name : Temperature (the name that will be displayed)
TextID : temperature (the unique identifier of the sensor type, just plain leters and underscore for easy management)
Unit : °C or °F (it's the unit that will be displayedon the graph and the widgets. Ex : "°C" will display "20.0°C" on the widget)
Minimal & Maximal values : Not used yet, but they'll be used for managing alarms later.
Click save and check eventual errors.
Select a sensor type from the "Pick a sensor type" dropdown menu. The sensor type will be loaded in the fields down.
Edit your values and click save.
Select a sensor type from the "Pick a sensor type" dropdown menu. The sensor type will be loaded in the fields down.
Click delete down the form.
